
Continuous Glucose Monitoring (CGM): Biofeedback You Didn't Know You Needed

Updated: Aug 9

A small wire under the skin is rewriting how clinicians and patients understand blood sugar. Continuous glucose monitoring (CGM) gives a live look at a signal that used to stay invisible. It works as glycemic feedback, and like all good biofeedback, it does more than display numbers. It teaches the body to listen to itself.

About this post. I am a biological psychologist and biofeedback researcher, not a physician, dietitian, or diabetes educator. I write here about CGM as a feedback instrument — what the signal is, where it errs, and how people learn from it — and about the behavioral side of glucose data, which is my field. The clinical claims are sourced to the primary literature and consensus guidelines cited throughout, but nothing here is medical advice.
Decisions about medication, diet, and whether to wear a sensor at all belong with your own clinician. I also live with Type 2 diabetes and wear a CGM; where I describe my own numbers, I say so.
A note on scope: this post addresses Type 2 diabetes and people without diabetes. Type 1 diabetes, pregnancy, and pump integration raise distinct issues I do not cover here.
This post explains what CGM is, why it helps people with and without diabetes, and how anyone can turn its feedback into smarter choices about food, movement, sleep, and stress.

A Sensor Turns Glucose Into a Story
Continuous glucose monitoring is a wearable system that estimates glucose around the clock through a small filament tucked just under the skin (American Diabetes Association Professional Practice Committee for Diabetes, 2026b).

The sensor does not measure blood directly. It samples interstitial fluid, the watery medium that surrounds body cells. Glucose moves from blood into this fluid with a brief delay, which clinicians call sensor lag.

During steady periods the lag is small. During rapid changes, such as the minutes after juice or a sprint, the screen value can trail the true value by 10 to 15 minutes (Uhl et al., 2024). Teaching this fact up front spares patients a good deal of frustration.
Watching glucose in real time is glycemic biofeedback. A patient sees the body respond to a meal, a walk, a rough night, or a tense phone call, and adjusts.

In Type 2 diabetes, a chronic condition marked by insulin resistance and declining insulin production, the sensor converts an invisible signal into a readable pattern. In insulin resistance, muscle, liver, and fat cells respond weakly to insulin. The pancreas releases more to compensate, but that reserve erodes over the years. Glucose then climbs higher after meals and lingers longer than expected.

The number on the screen is not a moral score, a diagnosis, or a perfect laboratory value. It is a trend line. The most useful clinical question is rarely "What is the value?" It is closer to, what pattern is this showing, and what safe experiment could we run together?
For practice: explain sensor lag at the very first visit. A patient who expects the screen to trail a rapid change will trust the device rather than abandon it.
Why the Signal Matters for People With and Without Diabetes
Two forces drive the rapid uptake of CGM. People with diabetes want richer feedback than a single morning finger stick can provide. People without diabetes are increasingly curious about glucose as a wellness metric. Clearance of the first over-the-counter sensor widened access, and updated diabetes technology standards encourage earlier use (American Diabetes Association Professional Practice Committee for Diabetes, 2026b; U.S. Food and Drug Administration, 2024b).
Healthy users often discover that soda, a late dinner, poor sleep, or a stressful meeting nudges their curve. Many have no framework for the observation. No consensus yet defines normal CGM patterns in people without diabetes, and a constant data stream can muddy the water as much as clarify it (Klonoff et al., 2023; Spartano et al., 2025). A journalist who studies wearable health data has made the same argument for a general audience (Yue, 2026).
Postprandial glucose, the glucose level after eating, is where many patterns hide. Carbohydrates break down into glucose, enter the blood, and fuel the brain and muscles. Insulin escorts that glucose into cells and smooths the curve.

The system works well until insulin resistance blunts it.

Glycemic variability describes the up-and-down movement of glucose across hours and days (Suh & Kim, 2015). Two people can share one average. One rides gentle hills, and the other careens through peaks and valleys. CGM earns its keep here because it shows shape, not only altitude.

Responses to the same meal vary widely from person to person. In a study of hundreds of adults, identical foods produced very different glucose responses, driven in part by the gut microbiome (Zeevi et al., 2015). CGM gives each person a personal map rather than a generic food chart. That is exactly why the device appeals to people with and without diabetes.
Two patients can post an identical average while one glides and the other lurches. The daily shape of glucose, not the single number, is what a sensor reveals and a lab test hides.
How Repeated Spikes May Injure Vessels and Nerves
The biological concern is that repeated sharp rises may strain small vessels and nerves over time. Laboratory and clinical studies link acute glucose swings to oxidative stress, the cellular damage that accumulates when reactive molecules overwhelm antioxidant defenses (Monnier et al., 2006; Suh & Kim, 2015). Those swings may also promote endothelial dysfunction, which is impaired health of the blood-vessel lining, and the buildup of advanced glycation end products (AGEs), sticky sugar-protein molecules that stiffen tissues over years.
This mechanism is not settled, and it is worth saying so plainly. A serious body of opinion holds that variability adds little predictive value once average glucose is accounted for, and the argument has been staged as a formal point-counterpoint in the literature (Bergenstal, 2015; Hirsch, 2015). A randomized trial that successfully reduced glucose variability at matched A1c did not improve cardiovascular risk markers (FLAT-SUGAR Trial Investigators, 2016). The honest summary is that variability is strongly associated with complications, plausibly mechanistic, and not yet demonstrated to be independently causal.
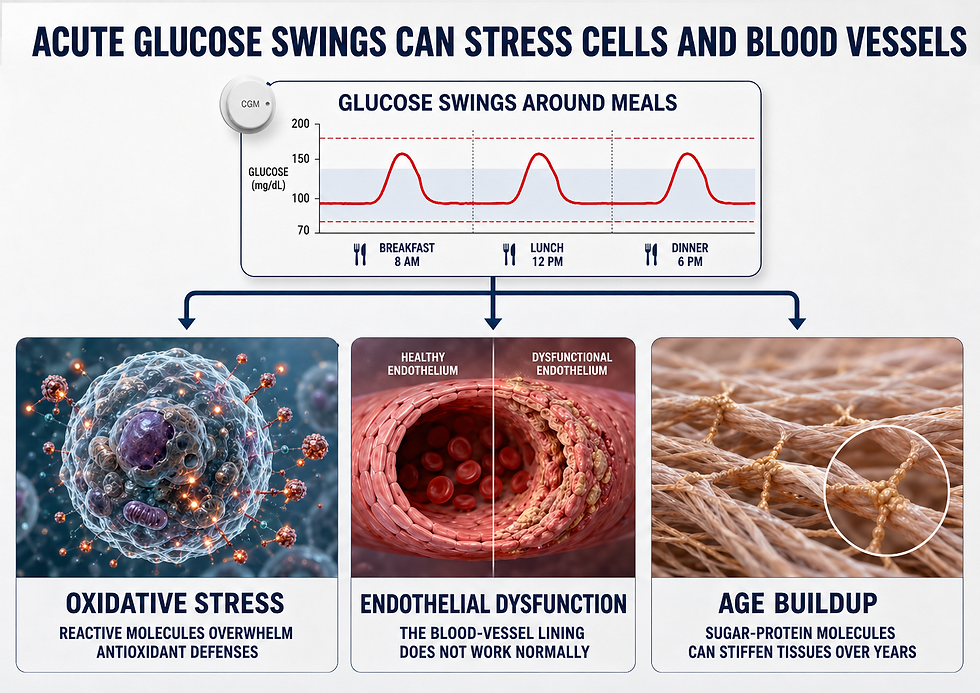
Where does 160 mg/dL fit? The International Diabetes Federation suggested a post-meal target below 160 mg/dL when it can be reached safely. Many CGM consensus reports use 70 to 180 mg/dL as the standard range for nonpregnant adults with diabetes (Battelino et al., 2019; Ceriello & Colagiuri, 2008; International Diabetes Federation, 2011). A spike over 160 is a meaningful early-warning signal, not a proven injury switch.
Peripheral neuropathy is damage to nerves of the feet, legs, hands, or arms. Lower CGM time in range has been associated with peripheral neuropathy in adults who have Type 2 diabetes and chronic kidney disease, even when A1c was less informative (Mayeda et al., 2020).

Cardiovascular autonomic neuropathy (CAN) is injury to the nerves that regulate heart rate and blood pressure. CGM time in range and time above range have both been linked to CAN in outpatients with Type 2 diabetes (Kim et al., 2021).

Retinopathy is damage to the small vessels of the retina, and nephropathy is kidney damage that often starts with albumin leaking into the urine. Studies in Type 2 diabetes have tied lower time in range to retinopathy and to albuminuria (Lu et al., 2018; Yoo et al., 2020).

A systematic review concluded that time in range is associated with microvascular outcomes, while noting that more prospective research is needed (Raj et al., 2022). Macrovascular disease involves larger vessels, including coronary, cerebral, and peripheral arteries.

Repeated spikes above 160 mg/dL may cumulatively raise risk, especially as part of a broader pattern of high time above range. The number invites pattern review and prevention rather than panic. One imperfect meal does not write a clinical sentence.
What the Trials Actually Show
The evidence for CGM is encouraging and still maturing. The MOBILE randomized trial in adults with Type 2 diabetes on basal insulin found that CGM beat finger-stick monitoring on A1c (Martens et al., 2021). Systematic reviews report a modest A1c reduction, more time in range, and less time above range, though most trials were short (Jancev et al., 2024; Uhl et al., 2024).
The evidence is widening beyond insulin-treated diabetes. A meta-analysis of trials in noninsulin-treated Type 2 diabetes found better glycemic control with CGM than with usual monitoring (Ferreira et al., 2024). A later food-choice trial in adults not taking insulin showed large within-group gains with CGM-supported self-care (Martens et al., 2025). A behavior-change review concluded that CGM feedback can lower A1c and raise time in range, with awareness as the likely mechanism (Richardson et al., 2024).
CGM improves glycemic outcomes when patients receive enough education, structured feedback, and follow-up to act on the data. The device alone is not the treatment. Interpretation and behavior change are the treatment pathway.
The Problem With Averages
Hemoglobin A1c (HbA1c) is a blood test that estimates average glucose exposure over roughly three months by measuring the fraction of hemoglobin bound to glucose (American Diabetes Association Professional Practice Committee for Diabetes, 2026a; Centers for Disease Control and Prevention, 2024).

It is clinically useful and historically central to diabetes care. But an average can hide the daily story, much as a region's average summer temperature hides every heat wave.
CGM brings a richer vocabulary. Time in range (TIR) is the percentage of readings within target, often 70 to 180 mg/dL. Time above range (TAR) is the percentage above target, often above 180 mg/dL. Time below range (TBR) is the percentage below target, often under 70 mg/dL, where safety becomes the dominant priority (Battelino et al., 2019).

Modern reports add three more summaries. The glucose management indicator (GMI) translates average sensor glucose into an A1c-like estimate (Bergenstal et al., 2018). The ambulatory glucose profile (AGP) compresses many days of readings into one composite daily pattern. The coefficient of variation (CV) summarizes how widely glucose spreads around the average.
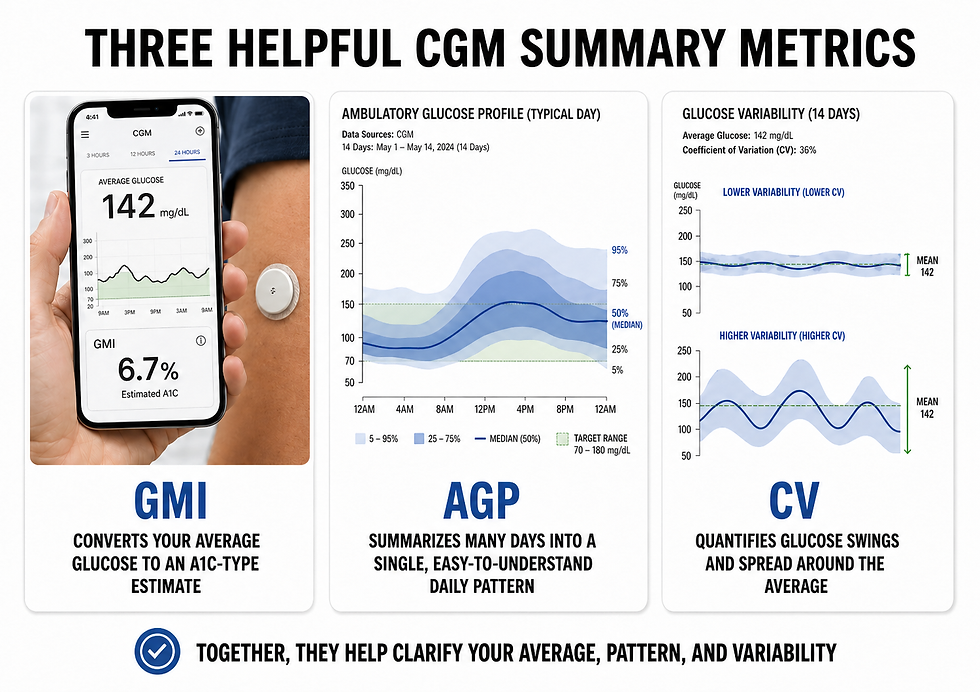
A patient can post acceptable fasting readings and still experience repeated post-meal peaks between 160 and 180 mg/dL. Fasting glucose is a single morning snapshot. A1c is a three-month blur. Neither one reliably reveals whether breakfast, dinner, stress, medication timing, or a late-night snack is the source of the trouble.
Reading Your Plate: The Foods and Snacks That Spike the Curve
The first practical use of CGM is simple. It shows which foods and snacks push glucose up, and how far. A patient wears the sensor for 10 to 14 days and changes as little as possible about food, movement, and sleep (Battelino et al., 2019). The goal is an honest picture of ordinary life, not perfect behavior.
Patterns emerge fast. White rice, juice, sweetened coffee, or a late cookie may each produce a visible peak, while eggs or nuts barely move the line. Because responses are personal, the sensor outperforms any generic glycemic-index chart (Zeevi et al., 2015). This appeals to people without diabetes who want to fine-tune wellness, and to people with diabetes who want fewer peaks.
Meal order is a high-yield experiment. Crossover trials in adults with Type 2 diabetes show that eating vegetables and protein first, with concentrated carbohydrates last, can cut post-meal peaks by roughly half compared with the reverse sequence (Shukla et al., 2017; Touhamy et al., 2025). The change needs no new food and translates easily into ordinary meals.
The sensor turns a vague rule into a personal test. A patient can eat the same dinner two nights in a row, switch the food order, and watch the peak fall by half. Proof on the screen beats advice on a handout.
What the trials tested: eating protein and vegetables before starch, adding fiber to breakfast, and trimming one portion of refined carbohydrate. The sensor lets a patient compare the trace across two similar meals and see which change matters for them. Sustained changes to a meal plan — particularly for someone taking insulin or a sulfonylurea — belong with a clinician or registered dietitian.
Movement You Can Watch Work
For most people, the advice to exercise more goes in one ear and out the other. The patient who dislikes the gym has already heard the guidelines and nodded politely at the promised benefits. None of it sticks, because none of it pays off today. Even the real lift in mood after a brisk walk arrives too quietly to compete with the comfort of the couch.
Continuous glucose monitoring changes the math by making the payoff impossible to miss. When a patient watches a 15-minute walk shave the top off a post-meal spike, the abstract becomes concrete, and the screen delivers the feedback in minutes rather than months.

Meta-analyses of post-meal movement support what the trace shows in real time. Walking soon after eating blunts the rise in glucose more effectively than the same walk taken earlier or later (Engeroff et al., 2023; Kang et al., 2023; Loh et al., 2020). Even 10 minutes can visibly flatten the curve. That visible win rewards the behavior on the spot and quietly builds the patient's confidence that their own choices move the needle.
Actionable step: encourage a 10- to 15-minute walk within an hour of the largest meal, and ask the patient to watch the peak fall on the sensor. Clear new activity with the treating clinician first when there is autonomic neuropathy, active retinopathy, foot ulceration, or treatment with insulin or a sulfonylurea, where exercise timing interacts with hypoglycemia risk.
When Stress, Illness, and Poor Sleep Move the Line
CGM also reveals influences unrelated to food. Acute psychological stress can raise glucose within minutes. Stress triggers counterregulatory hormones, including cortisol and adrenaline, that prompt the liver to release stored glucose (Sharma et al., 2022). In adults with Type 2 diabetes, an experimental stressor raised glucose measurably (Faulenbach et al., 2012). On the screen, a tense meeting can look a lot like a small meal.
Brief illness can do the same thing. Infection and other acute stress states raise counterregulatory hormones and provoke stress hyperglycemia, a temporary rise in glucose during acute illness (Dungan et al., 2009). A cold or a flare can lift the CGM trace for several days. Recognizing this pattern keeps a patient from blaming a food that was not the cause.
Sleep matters more than many patients expect. Obstructive sleep apnea (OSA), a disorder characterized by repeated nighttime pauses in breathing, is closely associated with insulin resistance and poorer glucose control (Reutrakul & Mokhlesi, 2017). Short sleep also impairs metabolism. Restricting healthy men to about 5 hours of sleep per night for 1 week reduced insulin sensitivity by roughly 11-20% (Buxton et al., 2010). A higher, flatter overnight trace after a poor night can open a useful conversation about sleep.
Mornings carry their own signal. The dawn phenomenon is a circadian rise in glucose in the early morning hours, driven by the normal overnight release of counterregulatory hormones.
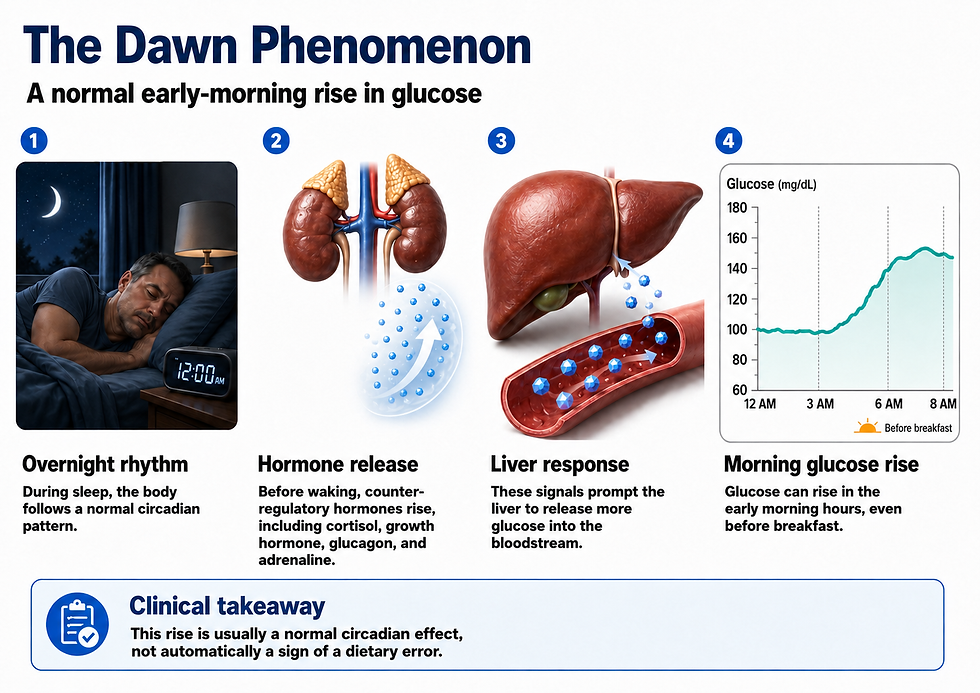
In Type 2 diabetes, its median magnitude by CGM is about 16 mg/dL, and it adds roughly 0.4 percent to HbA1c (Monnier et al., 2013). A patient who sees a pre-breakfast climb can learn that it reflects biology, not a midnight snack.
CGM turns invisible influences into visible feedback. Stress, infection, short sleep, and the dawn rise each leave a footprint on the trace. Naming the cause is often more useful than adjusting the last meal.
For practice: when overnight or morning glucose runs high without a dietary cause, screen for sleep apnea, ask about sleep duration and recent illness, and treat short-lived spikes as temporary rather than as failures.
Calibrating the Signal You Trust
A CGM reading is an estimate, and estimates deserve a cross-check. Sensor accuracy, often summarized as mean absolute relative difference (MARD), varies across the glucose range and during rapid change (Reiterer et al., 2017). A confirmatory fingerstick with a glucometer during a suspected low and a clear high teaches a patient how well the sensor tracks at both ends. This matters most when symptoms do not match the screen, a situation that calls for prompt confirmation before treating.
Calibration also works over longer windows. A patient can compare the CGM's multi-week average and its GMI against a laboratory HbA1c. The two rarely match exactly, because A1c is weighted toward recent weeks. Glucose from the preceding 30 days contributes about half of the A1c value, with progressively less weight given to earlier weeks (Tahara & Shima, 1995).
This weighting explains a common mismatch. A roughly 12-week CGM average and an A1c that reflects a similar but recency-weighted window can diverge when glucose has been changing. When the two agree, their confidence rises. When they diverge, the gap itself is information about a recent shift, sensor bias, or a red-cell condition that alters A1c (Reiterer et al., 2017; Tahara & Shima, 1995).
Trust the sensor, but verify it. A few paired finger sticks at the high and low ends calibrate a patient's eye for the whole range, and a GMI checked against a recency-weighted A1c calibrates the long view.
The author's experience: My own Type 2 diabetes values show how much these methods can diverge. Over 12 weeks, my average CGM reading corresponded to 6.2% while my lab A1c came in at 5.1%. At the moment of a lab blood draw, my CGM read 120 mg/dL against a lab value of 101 mg/dL. One morning while fasting, my CGM showed 119 mg/dL versus 111 mg/dL by finger stick. And 30 minutes after lunch, the CGM registered 186 mg/dL while a finger stick read just 136 mg/dL.

In the next section, we explore why these three measurement methods — CGM, finger stick, and lab blood draw — can disagree while remaining valid. The practical takeaway: check your CGM against finger-stick readings when the trend arrow is flat, and glucose is steady — while fasting, before a meal, and whenever your glucose runs low (below 70 mg/dL). A post-meal comparison is the least informative test you can run, because disagreement at the peak reflects expected physiology rather than device error. My own 186 versus 136 reading above demonstrates lag, not a faulty sensor.
One clarification about the verb. Most current sensors are factory-calibrated, and some cannot be user-calibrated at all. What these paired readings calibrate is your interpretation, not the device. Consult the manufacturer's instructions before entering any calibration value, and never enter one while glucose is changing rapidly.
Actionable steps: collect a small set of paired finger-stick and sensor values across the glucose range, each taken when the trend arrow is flat, and compare GMI with a laboratory A1c at each visit, treating any gap as a clue rather than an error.
Why CGM and Lab Values Disagree
A CGM number and a laboratory glucose can differ by 20, 30, or even 50 mg/dL. The gap rarely means that one device is broken. The two methods measure different fluid, at different moments, and each carries its own error. Understanding the sources of disagreement keeps patients and clinicians from chasing a false problem.
The sensor and the lab sample two different compartments. A blood draw measures glucose in blood, while the CGM estimates glucose in interstitial fluid. Glucose reaches the interstitial space by diffusing out of the capillaries, so the compartments are not identical when glucose is moving.

The physiologic delay measures about 5 to 6 minutes, and the sensor algorithm adds more, so the screen can trail true blood glucose by 10 minutes or longer during a rapid rise or fall (Basu et al., 2013; Schmelzeisen-Redeker et al., 2015).
The two values are almost never captured at the same instant. Glucose is a moving target. A venous sample captures a single moment, while the CGM reports a slightly older, smoothed estimate. A change of even 15 mg/dL in the intervening minutes can be mistaken for a device error.
Blood itself does not yield one single value. Plasma glucose, which the laboratory reports, runs about 11 percent higher than whole-blood glucose at a normal hematocrit, the fraction of blood made up of red cells (Higgins, 2008). Capillary blood glucose from a fingertip and venous blood glucose also differ. They are nearly equal when fasting, but after a meal, a fingertip reading can exceed a venous reading by roughly 20-25 mg/dL (Higgins, 2008).
Sample handling can pull the laboratory value down. After a draw, blood cells continue consuming glucose through glycolysis, the process of breaking down glucose for energy. Without prompt processing or an adequate preservative, glucose decreases by about 5 to 7 percent per hour, and standard fluoride tubes do not fully prevent this loss in the first hour (Higgins, 2008; Sacks et al., 2011). A sample that waits before spinning can read falsely low, which makes the CGM look falsely high.
The CGM carries its own error band. Its accuracy, summarized as MARD, averages roughly 8-10 percent and is worse on the first day and at the lower end of the range (Reiterer et al., 2017). A compression low, caused by lying on the sensor, can produce a sudden overnight false low that no blood draw would detect. High-dose acetaminophen can also falsely raise readings on some sensor chemistries (Maahs et al., 2015).
CGM and lab values agree best when glucose is flat and stable, such as fasting in the morning, and diverge most when it is changing fast. The honest comparison uses a flat trend arrow, not a post-meal peak, and treats a mismatch as expected physiology rather than a defect.
Actionable steps: compare a finger stick or lab draw with the sensor only when the trend arrow is flat and glucose is steady, confirm any low before treating it, and judge overall agreement by the multi-week average and GMI rather than a single paired reading. Approved wear sites differ by device and by generation, and the difference is not trivial. The Dexcom G6 was indicated for abdominal wear; the G7 (sold without a prescription as Stelo) is indicated for the back of the upper arm only in US adults. Site-specific accuracy data do not transfer automatically between locations. Follow the instructions for the specific sensor in use, and raise any question about placement with the prescribing clinician rather than improvising. After consultation, the author switched to an abdominal site (above the waistline) when CGM values were unacceptably high across the G7 sensor's range. In this case example, abdominal values achieved acceptable accuracy. If you experience the same issue, please talk to your physician.
What CGM Adds to Behavioral Health Care
Diabetes distress is the emotional weight of living with diabetes. It includes worry, frustration, shame, burnout, and the quiet exhaustion of decisions that never end. Distress is common across cultures and care settings, and it independently undermines glycemic control and well-being (Zu et al., 2024). It is also treatable.
A 2024 meta-analysis of randomized trials found that tailored psychological interventions, including cognitive-behavioral therapy and mindfulness, significantly reduced diabetes distress in adults with Type 2 diabetes (Zu et al., 2024). CGM can ease or worsen this picture, depending on how the data are framed. It can reduce distress by replacing guessing with understandable feedback. It can amplify distress when it becomes a constant reminder that the body is being watched and judged (Ehrmann et al., 2024). One version of that risk deserves its own name. For some people, continuous glucose data becomes a scoring system for eating. In anyone with a history of restrictive eating, orthorexia, or body-image disorder, a sensor can convert ordinary meals into a source of moral judgment delivered every 5 minutes, and the tighter the self-monitoring, the more the device rewards it. Screen for this history before recommending CGM as a wellness tool, watch for it developing in patients who already wear one, and be willing to recommend that the sensor come off.
For clinical psychologists and counselors, CGM functions as a behavioral map. A rise in glucose after a lonely evening snack is not just a nutritional event. It can be the visible footprint of an emotion-regulation loop that includes fatigue, deprivation, habit, reward, and self-criticism. Naming the loop is often more therapeutic than naming the carbohydrate.
Motivational interviewing is a collaborative counseling style that helps patients connect change to their own values rather than to instruction (Miller & Rollnick, 2013). It pairs naturally with CGM because the data invite curiosity rather than compliance. Useful prompts include what the patient noticed, what surprised them, and which small change feels realistic this week (Richardson et al., 2024).

Hypoglycemia, meaning low glucose and commonly defined as below 70 mg/dL, changes the safety calculus entirely. For patients on insulin or insulin-stimulating medications, trimming spikes must never create new lows. Clinicians should encourage prompt medical coordination when CGM reveals frequent or overnight lows, or symptoms that do not match the reading (Battelino et al., 2019).
What CGM Can Miss, Mislead, or Magnify
CGM has real limits that matter clinically. Because the sensor estimates glucose from interstitial fluid, rapid changes can appear late on the screen. Pressure on the sensor during sleep can occasionally produce falsely low readings. Skin irritation from adhesives is not unusual (Uhl et al., 2024). Sensors also have to be removed before MRI, CT, and X-ray imaging, which interrupts data at exactly the moments patients are most likely to be unwell.
CGM should not become a stand-alone diagnostic tool. People without diabetes lack a clear framework for interpreting every fluctuation, and constant data can produce confusion and needless anxiety when cost and interpretation are not addressed (Yue, 2026). The same caution applies in Type 2 diabetes, though the rationale for monitoring is stronger there. A single 180 mg/dL reading should be considered alongside the preceding meal, the medication regimen, the sleep window, and the broader report.
Not all wearables are equal. The FDA has warned consumers not to rely on smartwatches or smart rings that claim to measure glucose without piercing the skin, because no such device had been authorized (U.S. Food and Drug Administration, 2024a). Clinicians should ask exactly which device a patient uses. CGM can also widen health inequity, since sensors carry out-of-pocket costs and insurance rules vary by plan.
A single 180 mg/dL reading should not be catastrophized. It should be placed next to the preceding meal, the medication regimen, the sleep window, the activity log, and the broader CGM report.
Turning Sensor Data Into Better Conversations
A useful clinical rhythm starts simple. The patient wears CGM for 10 to 14 days while changing as little as possible in diet, activity, or sleep. The next visit converts the AGP into a single question. Why does breakfast produce a steep rise, or why does glucose drift upward overnight? One focused question is more actionable than ten ambient alarms.
Then comes the first experiment, and it should be small and safe. A patient might add protein or fiber to breakfast, rearrange meal order, or take a short post-meal walk (Engeroff et al., 2023; Shukla et al., 2017; Touhamy et al., 2025). A second experiment can address context by testing sleep, stress, alcohol, or illness, one variable at a time. The CGM serves as a hypothesis-checker rather than a verdict generator.
Medication conversations belong squarely in this rhythm. If time above range stays high despite feasible lifestyle changes, the report becomes evidence for a therapy discussion. If time below range is observed in a patient on insulin or a sulfonylurea, a safety review should occur promptly (Battelino et al., 2019). The CGM is not a substitute for prescribing judgment, but it is excellent shared data. Stated as plainly as it deserves: no one should change a medication dose on the basis of sensor readings without their prescriber.
The final piece is naming the win. For many adults with diabetes, the consensus goal is at least 70 percent time in range with minimal time below range, individualized for age, comorbidity, and hypoglycemia risk (Battelino et al., 2019). For some patients, the first win is fewer breakfast peaks or a lower CV. Naming a small, achievable target is what builds the self-efficacy that sustains change.
Integrative Summary
CGM is best understood as a pattern-recognition tool. It reveals what fasting glucose and HbA1c routinely hide: the daily rhythm of meals, movement, stress, sleep, illness, and recovery. In Type 2 diabetes, that rhythm matters because repeated high-glucose exposure may, over time, contribute to nerve, vascular, renal, and retinal injury (Raj et al., 2022).
In people without diabetes, the same feedback can guide food and movement, though it needs careful interpretation to avoid false alarms (Klonoff et al., 2023; Yue, 2026). The thesis holds with two guardrails. First, spikes over 160 mg/dL are meaningful but not a proven sharp threshold for damage. Second, CGM helps only when the data meet the criteria of education, calibration, safety planning, equitable access, and psychological context.

For healthcare providers, the practical promise of CGM is not more numbers. It is a better conversation. CGM helps patients trade vague failure narratives for testable hypotheses, smaller experiments, and more compassionate self-management. The technology cannot deliver that outcome on its own, but clinicians and patients can build it together with the data the sensor provides.
Five Key Takeaways
1. CGM is most powerful as patterned feedback, not as a verdict on a patient or a meal.
2. A1c and fasting glucose can look acceptable while post-meal peaks still occur between 160 and 180 mg/dL.
3. Food order, a short post-meal walk, better sleep, and stress management each leave a visible mark on the trace, so patients can safely test one change at a time.
4. Stress, brief illness, obstructive sleep apnea, short sleep, and the dawn phenomenon can all raise glucose with no dietary cause.
5. Confirm the sensor with occasional finger sticks at highs and lows, and compare its multi-week average and GMI against a recency-weighted laboratory A1c.

Glossary
advanced glycation end products (AGEs): sticky molecules that form when glucose binds to proteins or fats, contributing over time to vessel and tissue stiffness.
ambulatory glucose profile (AGP): a standardized CGM report that compresses several days of glucose readings into a single, easy-to-read daily pattern.
capillary blood glucose: glucose measured in blood from a fingertip; nearly equal to venous glucose when fasting but higher after meals.
cardiovascular autonomic neuropathy (CAN): diabetes-related injury to nerves that help regulate heart rate, blood pressure, and circulation.
coefficient of variation (CV): a percentage measure of glucose spread around the average; higher values mean greater variability.
compression low: a falsely low CGM reading caused by pressure on the sensor, such as lying on it during sleep.
continuous glucose monitoring (CGM): a wearable system that estimates glucose throughout the day and night using a small sensor placed under the skin.
cortisol: a hormone released by the adrenal glands during stress that, among other effects, raises blood glucose.
counterregulatory hormones: hormones such as cortisol, adrenaline, glucagon, and growth hormone that oppose insulin and raise blood glucose.
dawn phenomenon: an early-morning rise in glucose driven by the normal overnight release of counterregulatory hormones.
diabetes distress: the emotional strain, frustration, worry, or burnout related to the daily burden of living with diabetes.
endothelial dysfunction: reduced ability of blood-vessel lining cells to relax vessels and regulate inflammation, clotting, and blood flow.
glucose management indicator (GMI): a CGM-derived estimate of what hemoglobin A1c might be, calculated from average sensor glucose.
glycemic biofeedback: real-time or near-real-time glucose information used to guide behavior and treatment decisions.
glycemic variability: the degree to which glucose rises, falls, and oscillates over hours or days.
glycolysis: the breakdown of glucose for energy; it continues in a blood sample after collection and lowers the measured glucose.
hematocrit: the fraction of blood volume made up of red blood cells; it affects the difference between plasma and whole-blood glucose.
hemoglobin A1c (HbA1c): a blood test that estimates average glucose exposure over about three months by measuring the fraction of hemoglobin bound to glucose.
hypoglycemia: low glucose, commonly defined as below 70 mg/dL, which can cause shakiness, sweating, confusion, or fainting.
insulin resistance: reduced responsiveness of muscle, liver, and fat cells to insulin, making it harder to move glucose out of the bloodstream.
interstitial fluid: the watery fluid between body cells; CGM sensors estimate glucose from this fluid rather than directly from blood.
macrovascular disease: disease of larger blood vessels, including coronary, cerebral, and peripheral arteries.
mean absolute relative difference (MARD): a summary measure of CGM accuracy; lower percentages indicate closer agreement with reference glucose values.
motivational interviewing: a collaborative counseling style that helps patients connect health-behavior change to their own values and goals.
nephropathy: kidney damage that often begins with albumin leaking into urine and may progress to declining filtration.
obstructive sleep apnea (OSA): a disorder of repeated nighttime pauses in breathing that is linked to insulin resistance and impaired glucose control.
oxidative stress: cellular stress that occurs when reactive molecules overwhelm antioxidant defenses and damage proteins, fats, DNA, or vessels.
peripheral neuropathy: nerve damage in the feet, legs, hands, or arms that can cause numbness, pain, tingling, or loss of protective sensation.
plasma glucose: glucose measured in the liquid portion of blood after cells are removed; laboratory results are usually reported this way and run higher than whole-blood values.
postprandial glucose: the glucose level after eating a meal or snack.
retinopathy: damage to small blood vessels in the retina that can impair vision.
sensor lag: the brief delay between blood glucose changes and CGM-estimated glucose in interstitial fluid.
stress hyperglycemia: a temporary rise in blood glucose during acute illness or physiological stress.
time above range (TAR): the percentage of CGM readings above the target range, often above 180 mg/dL in diabetes care.
time below range (TBR): the percentage of CGM readings below the target range, often below 70 mg/dL.
time in range (TIR): the percentage of CGM readings within the target range, often 70 to 180 mg/dL for nonpregnant adults with diabetes.
Type 2 diabetes: a chronic metabolic condition in which insulin resistance and declining insulin production lead to elevated glucose.
venous blood glucose: glucose measured in blood drawn from a vein; the usual laboratory sample.
References
American Diabetes Association Professional Practice Committee for Diabetes. (2026a). 6. Glycemic goals, hypoglycemia, and hyperglycemic crises: Standards of Care in Diabetes—2026. Diabetes Care, 49(Suppl. 1), S132–S149. https://doi.org/10.2337/dc26-S006
American Diabetes Association Professional Practice Committee for Diabetes. (2026b). 7. Diabetes technology: Standards of Care in Diabetes—2026. Diabetes Care, 49(Suppl. 1), S150–S165. https://doi.org/10.2337/dc26-S007
Basu, A., Dube, S., Slama, M., Errazuriz, I., Amezcua, J. C., Kudva, Y. C., Peyser, T., Carter, R. E., Cobelli, C., & Basu, R. (2013). Time lag of glucose from intravascular to interstitial compartment in humans. Diabetes, 62(12), 4083–4087. https://doi.org/10.2337/db13-1132
Battelino, T., Danne, T., Bergenstal, R. M., Amiel, S. A., Beck, R., Biester, T., Bosi, E., Buckingham, B. A., Cefalu, W. T., Close, K. L., Cobelli, C., Dassau, E., DeVries, J. H., Donaghue, K. C., Dovc, K., Doyle, F. J., III, Garg, S., Grunberger, G., Heller, S., … Phillip, M. (2019). Clinical targets for continuous glucose monitoring data interpretation: Recommendations from the international consensus on time in range. Diabetes Care, 42(8), 1593–1603. https://doi.org/10.2337/dci19-0028
Bergenstal, R. M. (2015). Glycemic variability and diabetes complications: Does it matter? Simply put, there are better glycemic markers! Diabetes Care, 38(8), 1615–1621. https://doi.org/10.2337/dc15-0099
Bergenstal, R. M., Beck, R. W., Close, K. L., Grunberger, G., Sacks, D. B., Kowalski, A., Brown, A. S., Heinemann, L., Aleppo, G., Ryan, D. B., Riddlesworth, T. D., & Cefalu, W. T. (2018). Glucose management indicator (GMI): A new term for estimating A1C from continuous glucose monitoring. Diabetes Care, 41(11), 2275–2280. https://doi.org/10.2337/dc18-1581
Buxton, O. M., Pavlova, M., Reid, E. W., Wang, W., Simonson, D. C., & Adler, G. K. (2010). Sleep restriction for 1 week reduces insulin sensitivity in healthy men. Diabetes, 59(9), 2126–2133. https://doi.org/10.2337/db09-0699
Centers for Disease Control and Prevention. (2024, May 15). A1C test for diabetes and prediabetes. https://www.cdc.gov/diabetes/diabetes-testing/prediabetes-a1c-test.html
Ceriello, A., & Colagiuri, S. (2008). International Diabetes Federation guideline for management of postmeal glucose: A review of recommendations. Diabetic Medicine, 25(10), 1151–1156. https://doi.org/10.1111/j.1464-5491.2008.02565.x
Dexcom, Inc. (2025). Where can I insert my Dexcom G7 sensor? https://www.dexcom.com/en-us/faqs/where-can-i-insert-my-dexcom-g7-sensor
Dungan, K. M., Braithwaite, S. S., & Preiser, J.-C. (2009). Stress hyperglycaemia. The Lancet, 373(9677), 1798–1807. https://doi.org/10.1016/S0140-6736(09)60553-5
Ehrmann, D., Hermanns, N., Schmitt, A., Klinker, L., Haak, T., & Kulzer, B. (2024). Perceived glucose levels matter more than CGM-based data in predicting diabetes distress in type 1 or type 2 diabetes: A precision mental health approach using n-of-1 analyses. Diabetologia, 67(11), 2433–2445. https://doi.org/10.1007/s00125-024-06239-9
Engeroff, T., Groneberg, D. A., & Wilke, J. (2023). After dinner rest a while, after supper walk a mile? A systematic review with meta-analysis on the acute postprandial glycemic response to exercise before and after meal ingestion in healthy subjects and patients with impaired glucose tolerance. Sports Medicine, 53(4), 849–869. https://doi.org/10.1007/s40279-022-01808-7
Faulenbach, M., Uthoff, H., Schwegler, K., Spinas, G. A., Schmid, C., & Wiesli, P. (2012). Effect of psychological stress on glucose control in patients with type 2 diabetes. Diabetic Medicine, 29(1), 128–131. https://doi.org/10.1111/j.1464-5491.2011.03431.x
Ferreira, R. O. M., Trevisan, T., Pasqualotto, E., Chavez, M. P., Marques, B. F., Lamounier, R. N., & van de Sande-Lee, S. (2024). Continuous glucose monitoring systems in noninsulin-treated people with type 2 diabetes: A systematic review and meta-analysis of randomized controlled trials. Diabetes Technology & Therapeutics, 26(4), 252–262. https://doi.org/10.1089/dia.2023.0390
FLAT-SUGAR Trial Investigators. (2016). Glucose variability in a 26-week randomized comparison of mealtime treatment with rapid-acting insulin versus GLP-1 agonist in participants with type 2 diabetes at high cardiovascular risk. Diabetes Care, 39(6), 973–981. https://doi.org/10.2337/dc15-2782
Higgins, C. (2008). Measurement of circulating glucose: The problem of inconsistent sample and methodology. Acute Care Testing. https://acutecaretesting.org/en/articles/measurement-of-circulating-glucose-the-problem-of-inconsistent-sample-and-methodology
Hirsch, I. B. (2015). Glycemic variability and diabetes complications: Does it matter? Of course it does! Diabetes Care, 38(8), 1610–1614. https://doi.org/10.2337/dc14-2898
International Diabetes Federation. (2011). 2011 guideline for management of postmeal glucose in diabetes. International Diabetes Federation.
Jancev, M., Vissers, T. A. C. M., Visseren, F. L. J., van Bon, A. C., Serné, E. H., DeVries, J. H., de Valk, H. W., & van Sloten, T. T. (2024). Continuous glucose monitoring in adults with type 2 diabetes: A systematic review and meta-analysis. Diabetologia, 67(5), 798–810. https://doi.org/10.1007/s00125-024-06107-6
Kang, J., Fardman, B. M., Ratamess, N. A., Faigenbaum, A. D., & Bush, J. A. (2023). Efficacy of postprandial exercise in mitigating glycemic responses in overweight individuals and individuals with obesity and type 2 diabetes—A systematic review and meta-analysis. Nutrients, 15(20), 4489. https://doi.org/10.3390/nu15204489
Kim, M. Y., Kim, G., Park, J. Y., Choi, M. S., Jun, J. E., Lee, Y. B., Jin, S. M., Hur, K. Y., & Kim, J. H. (2021). The association between continuous glucose monitoring-derived metrics and cardiovascular autonomic neuropathy in outpatients with type 2 diabetes. Diabetes Technology & Therapeutics, 23(6), 434–442. https://doi.org/10.1089/dia.2020.0599
Klonoff, D. C., Nguyen, K. T., Xu, N. Y., Gutierrez, A., Espinoza, J. C., & Vidmar, A. P. (2023). Use of continuous glucose monitors by people without diabetes: An idea whose time has come? Journal of Diabetes Science and Technology, 17(6), 1686–1697. https://doi.org/10.1177/19322968221110830
Loh, R., Stamatakis, E., Folkerts, D., Allgrove, J. E., & Moir, H. J. (2020). Effects of interrupting prolonged sitting with physical activity breaks on blood glucose, insulin and triacylglycerol measures: A systematic review and meta-analysis. Sports Medicine, 50(2), 295–330. https://doi.org/10.1007/s40279-019-01183-w
Lu, J., Ma, X., Zhou, J., Zhang, L., Mo, Y., Ying, L., Lu, W., Zhu, W., Bao, Y., Vigersky, R. A., & Jia, W. (2018). Association of time in range, as assessed by continuous glucose monitoring, with diabetic retinopathy in type 2 diabetes. Diabetes Care, 41(11), 2370–2376. https://doi.org/10.2337/dc18-1131
Maahs, D. M., DeSalvo, D., Pyle, L., Ly, T., Messer, L., Clinton, P., Westfall, E., Wadwa, R. P., & Buckingham, B. (2015). Effect of acetaminophen on CGM glucose in an outpatient setting. Diabetes Care, 38(10), e158–e159. https://doi.org/10.2337/dc15-1096
Martens, T., Beck, R. W., Bailey, R., Ruedy, K. J., Calhoun, P., Peters, A. L., Pop-Busui, R., Philis-Tsimikas, A., Bao, S., Umpierrez, G., Davis, G., Kruger, D., Bhargava, A., Young, L., McGill, J. B., Aleppo, G., Nguyen, Q. T., Orozco, I., Biggs, W., … Bergenstal, R. M. (2021). Effect of continuous glucose monitoring on glycemic control in patients with type 2 diabetes treated with basal insulin: A randomized clinical trial. JAMA, 325(22), 2262–2272. https://doi.org/10.1001/jama.2021.7444
Martens, T. W., Willis, H. J., Bergenstal, R. M., Kruger, D. F., Karslioglu-French, E., & Steenkamp, D. W. (2025). A randomized controlled trial using continuous glucose monitoring to guide food choices and diabetes self-care in people with type 2 diabetes not taking insulin. Diabetes Technology & Therapeutics, 27(4), 261–270. https://doi.org/10.1089/dia.2024.0579
Mayeda, L., Katz, R., Ahmad, I., Bansal, N., Batacchi, Z., Hirsch, I. B., Robinson, N., Trence, D. L., Zelnick, L., & de Boer, I. H. (2020). Glucose time in range and peripheral neuropathy in type 2 diabetes mellitus and chronic kidney disease. BMJ Open Diabetes Research & Care, 8(1), e000991. https://doi.org/10.1136/bmjdrc-2019-000991
Miller, W. R., & Rollnick, S. (2013). Motivational interviewing: Helping people change (3rd ed.). Guilford Press.
Monnier, L., Colette, C., Dejager, S., & Owens, D. (2013). Magnitude of the dawn phenomenon and its impact on the overall glucose exposure in type 2 diabetes: Is this of concern? Diabetes Care, 36(12), 4057–4062. https://doi.org/10.2337/dc12-2127
Monnier, L., Mas, E., Ginet, C., Michel, F., Villon, L., Cristol, J. P., & Colette, C. (2006). Activation of oxidative stress by acute glucose fluctuations compared with sustained chronic hyperglycemia in patients with type 2 diabetes. JAMA, 295(14), 1681–1687. https://doi.org/10.1001/jama.295.14.1681
Raj, R., Mishra, R., Jha, N., Joshi, V., Correa, R., & Kern, P. A. (2022). Time in range, as measured by continuous glucose monitor, as a predictor of microvascular complications in type 2 diabetes: A systematic review. BMJ Open Diabetes Research & Care, 10(1), e002573. https://doi.org/10.1136/bmjdrc-2021-002573
Reiterer, F., Polterauer, P., Schoemaker, M., Schmelzeisen-Redeker, G., Freckmann, G., Heinemann, L., & del Re, L. (2017). Significance and reliability of MARD for the accuracy of CGM systems. Journal of Diabetes Science and Technology, 11(1), 59–67. https://doi.org/10.1177/1932296816662047
Reutrakul, S., & Mokhlesi, B. (2017). Obstructive sleep apnea and diabetes: A state of the art review. Chest, 152(5), 1070–1086. https://doi.org/10.1016/j.chest.2017.05.009
Richardson, K. M., Jospe, M. R., Bohlen, L. C., Crawshaw, J., Saleh, A. A., & Schembre, S. M. (2024). The efficacy of using continuous glucose monitoring as a behaviour change tool in populations with and without diabetes: A systematic review and meta-analysis of randomised controlled trials. International Journal of Behavioral Nutrition and Physical Activity, 21(1), 143. https://doi.org/10.1186/s12966-024-01692-6
Sacks, D. B., Arnold, M., Bakris, G. L., Bruns, D. E., Horvath, A. R., Kirkman, M. S., Lernmark, A., Metzger, B. E., & Nathan, D. M. (2011). Guidelines and recommendations for laboratory analysis in the diagnosis and management of diabetes mellitus. Diabetes Care, 34(6), e61–e99. https://doi.org/10.2337/dc11-9998
Schmelzeisen-Redeker, G., Schoemaker, M., Kirchsteiger, H., Freckmann, G., Heinemann, L., & del Re, L. (2015). Time delay of CGM sensors: Relevance, causes, and countermeasures. Journal of Diabetes Science and Technology, 9(5), 1006–1015. https://doi.org/10.1177/1932296815590154
Sharma, K., Akre, S., Chakole, S., & Wanjari, M. B. (2022). Stress-induced diabetes: A review. Cureus, 14(9), e29142. https://doi.org/10.7759/cureus.29142
Shukla, A. P., Andono, J., Touhamy, S. H., Casper, A., Iliescu, R. G., Mauer, E., Shan
Zhu, Y., Ludwig, D. S., & Aronne, L. J. (2017). Carbohydrate-last meal pattern lowers postprandial glucose and insulin excursions in type 2 diabetes. BMJ Open Diabetes Research & Care, 5(1), e000440. https://doi.org/10.1136/bmjdrc-2017-000440
Spartano, N. L., Sultana, N., Lin, H., Cheng, H., Lu, S., Fei, D., Murabito, J. M., Walker, M. E., Wolpert, H. A., & Steenkamp, D. W. (2025). Defining continuous glucose monitor time in range in a large, community-based cohort without diabetes. The Journal of Clinical Endocrinology & Metabolism, 110(4), 1128–1134. https://doi.org/10.1210/clinem/dgae626
Suh, S., & Kim, J. H. (2015). Glycemic variability: How do we measure it and why is it important? Diabetes & Metabolism Journal, 39(4), 273–282. https://doi.org/10.4093/dmj.2015.39.4.273
Tahara, Y., & Shima, K. (1995). Kinetics of HbA1c, glycated albumin, and fructosamine and analysis of their weight functions against preceding plasma glucose level. Diabetes Care, 18(4), 440–447. https://doi.org/10.2337/diacare.18.4.440
Touhamy, S., II, Palepu, K., Karan, A., Hootman, K. C., Riad, J., Sripadrao, S., Zhao, A. S., Giannita, A., D'Angelo, D., Alonso, L. C., Aronne, L. J., & Shukla, A. P. (2025). Carbohydrates-last food order improves time in range and reduces glycemic variability. Diabetes Care, 48(2), e15–e16. https://doi.org/10.2337/dc24-1956
Uhl, S., Choure, A., Rouse, B., Loblack, A., & Reaven, P. (2024). Effectiveness of continuous glucose monitoring on metrics of glycemic control in type 2 diabetes mellitus: A systematic review and meta-analysis of randomized controlled trials. The Journal of Clinical Endocrinology & Metabolism, 109(4), 1119–1131. https://doi.org/10.1210/clinem/dgad652
U.S. Food and Drug Administration. (2024a, February 21). Do not use smartwatches or smart rings to measure blood glucose levels: FDA safety communication. https://www.fda.gov/medical-devices/safety-communications/do-not-use-smartwatches-or-smart-rings-measure-blood-glucose-levels-fda-safety-communication
U.S. Food and Drug Administration. (2024b, March 5). FDA clears first over-the-counter continuous glucose monitor. https://www.fda.gov/news-events/press-announcements/fda-clears-first-over-counter-continuous-glucose-monitor
Yoo, J. H., Choi, M. S., Ahn, J., Park, S. W., Kim, Y., Hur, K. Y., Jin, S. M., Kim, G., & Kim, J. H. (2020). Association between continuous glucose monitoring-derived time in range, other core metrics, and albuminuria in type 2 diabetes. Diabetes Technology & Therapeutics, 22(10), 768–776. https://doi.org/10.1089/dia.2019.0499
Yue, L. (2026). I study wearable health data. Here's what continuous glucose monitors miss. The Washington Post.
Zeevi, D., Korem, T., Zmora, N., Israeli, D., Rothschild, D., Weinberger, A., Ben-Yacov, O., Lador, D., Avnit-Sagi, T., Lotan-Pompan, M., Suez, J., Mahdi, J. A., Matot, E., Malka, G., Kosower, N., Rein, M., Zilberman-Schapira, G., Dohnalová, L., Pevsner-Fischer, M., … Segal, E. (2015). Personalized nutrition by prediction of glycemic responses. Cell, 163(5), 1079–1094. https://doi.org/10.1016/j.cell.2015.11.001
Zu, W., Zhang, S., Du, L., Huang, X., Nie, W., & Wang, L. (2024). The effectiveness of psychological interventions on diabetes distress and glycemic level in adults with type 2 diabetes: A systematic review and meta-analysis. BMC Psychiatry, 24(1), 660. https://doi.org/10.1186/s12888-024-06125-z
About the Author
Fred Shaffer earned his PhD in Psychology from Oklahoma State University. He earned BCIA certifications in Biofeedback and HRV Biofeedback. Fred is an Allen Fellow and Professor of Psychology at Truman State University, where he has taught for 50 years. He is a Biological Psychologist who consults and lectures in heart rate variability biofeedback, Physiological Psychology, and Psychopharmacology. Fred helped to edit Evidence-Based Practice in Biofeedback and Neurofeedback (3rd and 4th eds.) and helps to maintain BCIA's certification programs. He is a recipient of AAPB's Distinguished Scientist Award and BFE's Lifetime Impact Award.

Support Our Friends



Comments