
Does Breakfast Change Brainwaves? A Careful Look at the qEEG Evidence

Updated: Aug 13

Every neurofeedback provider asks a client to sit quietly and produce a few minutes of resting brain activity. Almost nobody asks what that client ate beforehand.

A 2017 single-case study in NeuroRegulation suggested that the omission may matter (MacInerney et al., 2017). The authors recorded three brain maps on one 12-year-old girl under three breakfast conditions and found striking differences in a single frequency band.
This post examines that study closely, examines it in the wider literature on food and the electroencephalogram, and asks what a careful clinician should actually do with the finding.
About this post. I am a biological psychologist and biofeedback researcher, not a physician, dietitian, pediatrician, or diabetes educator. I write here about the EEG as a measurement instrument, about what the signal can and cannot support, and about the behavioral science of eating and arousal, which is my field. The clinical and nutritional claims are sourced from the primary literature cited throughout, but nothing here is medical or nutritional advice.
Decisions about a child’s diet, meal timing, evaluation, or treatment belong with that child and their parents, the child’s own clinician, and a registered dietitian nutritionist.
A note on scope: this post addresses resting and task-related EEG in healthy children and adults. Hypoglycemia management in diabetes, disordered eating, and clinical malnutrition raise distinct issues that I do not cover here.
The Case That Started the Conversation
MacInerney and colleagues (2017) studied one healthy, neurotypical 12-year-old girl who described herself as a habitual breakfast skipper. Over three weeks, they collected three quantitative electroencephalography (qEEG) recordings, a method that converts raw brain electrical activity into frequency-specific power values and compares them against an age-matched reference sample.
Each recording began at noon on a school day, in an eyes-closed resting condition, after eight hours of sleep. The three conditions were no breakfast, a toaster pastry with orange juice, and a balanced meal of eggs, toast, tomatoes, fruit, and milk. All 19 electrode sites used a linked ears montage, meaning both earlobes served as the common reference point.
Only one part of the EEG spectrum differed between breakfast conditions. Delta, theta, alpha, and low beta stayed within normal variation across all three days. In the no-breakfast recording, absolute power in the 26 to 28 Hz range reached 2.0 to 4.0 standard deviations above the normative mean at eight sites, averaging 2.9 standard deviations (MacInerney et al., 2017). These were predominantly frontal electrode sites: F3, Fz, and F4. After the high-sugar meal, the deviations shifted to 27 to 30 Hz and ranged from 2.0 to 3.5 standard deviations at nine sites, again mostly at F3, Fz, and F4. After the balanced meal, no site deviated significantly anywhere in high beta, the band spanning roughly 20 to 30 Hz.
The subject also told the investigators that her anxiety was nearly absent and her focus was best after the balanced breakfast. The authors concluded that a nutritionally balanced meal normalized the qEEG and that breakfast may regulate anxiety and attention in children. They were careful about the limits of what they had done. They wrote that controlled studies are needed before anyone generalizes, and they noted that a single healthy child does not represent the general population.
So the problem is not the paper. The problem is what happens to a finding like this once it leaves the paper. Results from single cases travel quickly through clinical training, conference talks, and marketing copy, and they lose their qualifiers along the way. A clinician who hears that breakfast normalizes the brain map has heard something the study cannot support.
A single case is a hypothesis-generating instrument, not a hypothesis-testing one, and MacInerney and colleagues said as much themselves. The value of their study lies in the question it raises. That question is whether a client's eating state silently shapes the brain map we then use to build a treatment plan.

What the Broader EEG Literature Actually Shows
The largest EEG study of breakfast in children came from the Arkansas Children’s Nutrition Center. Pivik and colleagues (2012) recorded 81 healthy children aged 8 to 11 while they solved simple addition problems, first after an overnight fast and again after either eating or continuing to fast. They applied time-frequency analysis, a method that tracks how power in each frequency band rises and falls across the moments of a task.
Compared with fed children, those who kept fasting showed greater power increases in upper theta at 6 to 8 Hz and in both alpha bands at 8 to 10 and 10 to 12 Hz over frontal and parietal regions.
The authors read this as evidence that children who omitted their breakfast and continued their overnight fast before arithmetic tasks recruited more effort for the same arithmetic. Studies using event-related potential (ERP) methods, which average brain responses time-locked to a stimulus, point in the same direction.
González-Garrido and colleagues (2019) tested 20 university students on working memory tasks after a normal breakfast and after a 12-hour overnight fast. Fasting produced fewer correct responses, mainly on the highest memory load, along with changes in the early stages of stimulus processing.
Walk and colleagues (2017) gave preadolescents mixed macronutrient drinks or a glucose placebo after an overnight fast. The clearest result was in P3 amplitude across all three carbohydrate groups. The P3 (P300) is a positive wave that arises roughly 300 milliseconds after a stimulus and indexes attentional allocation. The P3 increased over time after the noncaloric placebo but remained stable after the carbohydrate-containing drink.
That P3 finding deserves a closer look. The effect disappeared once the analysts accounted for changes in blood glucose, which suggests glucose in the placebo was the operative variable rather than the placebo itself (Walk et al., 2017). The behavioral effects and the N2, an earlier negative wave linked to attentional inhibition, showed only small and selective differences. Glucose did something measurable, and the effect was modest.
Resting studies in adults tell a consistent story about which frequencies move. Hoffman and Polich (1998) recorded adults after an overnight fast, before and after a standard lunch. Delta power fell, while theta and early alpha frequency rose. P300 amplitude did not change and its latency increased. Their conclusion was that food consumption shifts general arousal rather than specific cognitive EEG or ERP processes.
An and colleagues (2015) asked 24 healthy volunteers to fast for at least eight hours, recorded resting EEG and attention tests, then repeated both after a glucose-rich drink. Theta at 4 to 8 Hz and low alpha at 8 to 10 Hz increased across the whole brain, most prominently over frontal and parieto-occipital regions, and attention performance improved.
Walker and colleagues (2021) ran an experimenter-blind crossover experimental design with 75 grams of glucose against water. Blood glucose showed an inverted-U relationship with individual alpha frequency (IAF), the peak frequency of a person’s dominant alpha rhythm. The aperiodic component, the smooth background slope of the power spectrum that underlies all the oscillatory peaks, became less steep as glucose rose.
One study found nothing at all. Almeneessier and colleagues (2019) monitored eight healthy young adults across five conditions of diurnal intermittent fasting, controlling sleep and lifestyle. They found no difference in absolute power for delta, theta, alpha, or beta in any brain region during any study period.
Across the controlled studies that measured it, eating moves the low end of the spectrum. Delta falls, theta and alpha shift, and the background slope of the spectrum flattens. Not one of these studies reported the resting high-beta effect that the MacInerney et al. (2017) single-case study described, which does not disprove it but does leave it standing alone.

Glucose Changes the EEG, but Not the Way Most People Assume
The EEG genuinely does register blood glucose, and clinicians should know where that threshold sits. Pramming and colleagues (1988) lowered blood glucose gradually in 13 patients with insulin-dependent diabetes while recording continuously. No EEG changes appeared while glucose stayed above 3 mmol/L, roughly 54 mg/dL. At a median of 2.0 mmol/L, alpha activity dropped abruptly, and theta rose, reflecting cortical dysfunction.
Blaabjerg and Juhl (2016) reviewed this literature and described the earliest abnormality as increased total power with generalized slowing, meaning delta and theta gain relative power at the expense of alpha.
Now apply that threshold to a healthy 12-year-old who skipped one meal. She is not remotely near hypoglycemia, defined as abnormally low blood glucose, nor near neuroglycopenia, the state in which the brain’s glucose supply falls short of its metabolic demand.
A healthy child fasting overnight and sitting for a recording at noon holds a glucose concentration well above the level at which the EEG changes at all. Whatever a skipped breakfast does to a brain map, fuel starvation of the cortex is almost certainly not the mechanism.
There is a deeper mechanistic reason for caution in drawing conclusions. Adolphus and colleagues (2016) noted in their systematic review that brain extracellular glucose runs at only about 20 to 30 percent of blood concentration. They also pointed out that neuronal glucose uptake is driven by neural activity rather than by extracellular concentration. Raising blood glucose therefore produces only small increases in the brain’s extracellular pool, and it is unlikely on its own to change brain activity. The intuitive fuel-gauge model of breakfast and brainwaves does not survive contact with the physiology.
Non-EEG imaging supports the arousal and engagement account. Fulford and colleagues (2016) scanned 20 children aged 12 to 14 during cognitive tasks in a randomized, counterbalanced fasted-and-fed design. Task performance did not differ significantly, but activation was higher in frontal, premotor, and primary visual cortex after breakfast. Something changes when children eat, and it looks more like effort, engagement, and blood flow than like a metabolic rescue. Hoffman and Polich reached that same conclusion about arousal nearly three decades ago.
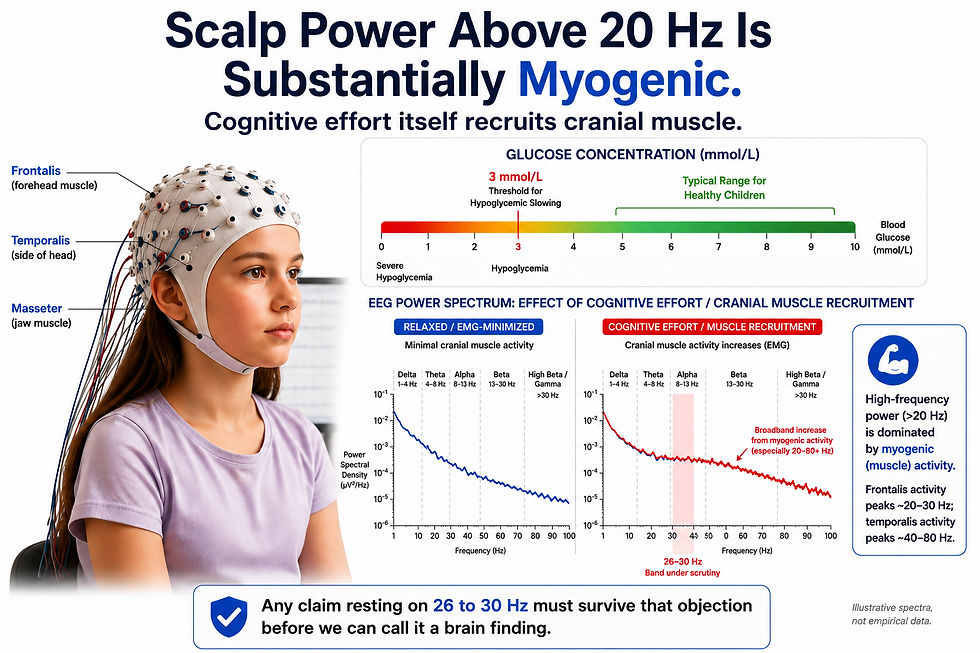
The EEG does respond to glucose, but only at concentrations far below anything a healthy child reaches by missing one meal. The threshold for hypoglycemic slowing sits near 3 mmol/L. That number reframes the whole question, because it moves the plausible mechanism away from fuel and toward arousal, attention, and hunger.

Why High Beta Is the Least Trustworthy Band on the Map
Here, MacInerney et al.’s (2017) single-case study runs into its hardest problem. The entire finding falls between 25 and 30 Hz, which is solidly within the range where muscle electrical activity mimics brain electrical activity. Whitham and colleagues (2007) recorded scalp EEG in wakeful volunteers before and after complete neuromuscular blockade, which silences all skeletal muscle while leaving the person conscious.
The most striking feature of the records from paralyzed volunteers was a large power reduction above 20 to 30 Hz. In other words, much of what we routinely call high beta in an awake person is vulnerable to electromyographic (EMG) contamination, electrical activity from scalp and jaw muscles that can be picked up by EEG electrodes.
Goncharova and colleagues (2003) had already mapped this problem in detail. They recorded 64 scalp sites in 25 adults during relaxation and during graded contractions of the frontalis and temporalis muscles. Muscle activity spread across the entire scalp, with a spectrum overlapping beta and gamma, and maximal power above 30 Hz. Frontal and temporal electrodes carried the strongest myogenic signal, since they sit closest to those muscles. Any elevation reported at F7, F3, Fz, F4, T5, or T6 deserves a muscle check before it earns a neural interpretation.
The complication runs deeper still. Whitham and colleagues (2008) went on to show that thinking can be associated with scalp EMG activity producing gamma-band EEG (30-100 Hz). Cognitive effort was correlated with a generalized rise in high-frequency electrical power that standard EEG artifact rejection, the process of discarding contaminated segments of the record, could not remove. So, it is possible that a child who feels hungry and is thinking about where his or her next meal is coming from, or who is restless, or slightly on edge, may generate more nearby 25 to 30 Hz power through jaw and forehead tension alone.
A second measurement issue compounds the first. Donoghue and colleagues (2020) demonstrated that conventional band analysis conflates oscillatory power with the aperiodic background. When the slope or offset of that background shifts, power in every band shifts with it, even though no oscillation has changed. Walker and colleagues (2021) found that glucose does alter the aperiodic slope.
A fed-versus-fasted difference in high beta absolute power could therefore reflect a broadband change in the background spectrum rather than a beta rhythm.
High-beta EEG power is easily overpowered by muscle electrical activity. Quantitative evidence from paralyzed but wakeful volunteers shows that scalp power above 20 Hz is substantially myogenic, and cognitive effort itself recruits cranial muscle. Any claim resting on 26 to 30 Hz must survive that objection before we can call it a brain finding.
What Excess Beta Actually Predicts
MacInerney and colleagues (2017) interpreted their high beta elevations as anxiety and impaired frontal self-regulation, citing Clarke and colleagues (2001). That original paper did identify a real electrophysiological subgroup. Roughly 20 percent of children with the combined type of attention-deficit/hyperactivity disorder showed excess beta rather than the excess slow activity typical of the condition, and that subgroup was described as moodier and more prone to temper outbursts. The label attached to the pattern at the time was hyperarousal, and it was offered as a tentative hypothesis.
The same laboratory then tested the hypothesis directly. Clarke and colleagues (2013) simultaneously recorded EEG and skin conductance level (SCL), a long-established autonomic index of central nervous system arousal, in 104 boys with the disorder and 67 matched controls during 10.5 minutes of eyes-closed rest. ADHD subjects were divided into those with excess theta or excess beta.
Both clinical groups showed reduced skin conductance compared with controls. Crucially, the excess beta group did not differ from the excess theta group on skin conductance at all. The authors concluded that children with excess beta are not hyperaroused.
The same paper confirmed that the theta/beta ratio, the proportion of slow to fast activity long promoted as an arousal index, is not associated with arousal either. Barry and colleagues (2004) had already reported this in typically developing boys. Relative delta, theta, and beta power and the theta/beta ratio all failed to distinguish groups that differed markedly in skin conductance. Alpha, not beta, tracked arousal in those data. The inferential chain running from high beta to arousal to anxiety therefore rests on a link that its own discoverers (Clark et al., 2001) examined and rejected in their 2013 study.
None of this makes the beta band meaningless. It means the band carries a different kind of information than clinical shorthand suggests. Excess beta appears to be a trait-level profile in a clinical population, not a moment-to-moment state marker that rises and falls with how a healthy child feels. Reading a client’s mood off a high beta map borrows authority the evidence does not extend.
The laboratory that discovered the excess beta subtype later tested the hyperarousal reading and rejected it. Frontal beta amplitude should not be reflexively interpreted as excess arousal with children who present ADHD. Even though excess frontal beta activity is correlated with increased anxiety, as reported by Jang and colleagues (2023) and Wang and colleagues (2025), it is important to consider it only one part of the picture and to pursue other sources of information to corroborate or disconfirm the hypothesis.
Careful comparison of fast activity with slower activity can still reveal something useful. The question is how much high beta (roughly 20 to 30 Hz) appears alongside the slow rhythms that should dominate a resting record. A record with little slow rhythmic activity and typical or elevated fast beta suggests heightened cortical arousal. Clinicians have long called this pattern the low-voltage fast EEG, in which the posterior dominant rhythm, the alpha activity that normally emerges over the back of the head, fails to appear during eyes-closed rest.
Some authors read this pattern as reduced activity in the default mode network, the set of regions most active when a person rests rather than performs a task (Yuan, 2023). The figure below is from Schimmelpfennig and colleagues (2023).

On that account, cortical neurons remain activated and never settle into the resting state that supports recovery. Default mode network dysfunction has also been proposed to distinguish generalized anxiety disorder from social anxiety disorder and posttraumatic stress disorder.
The practical conclusion is that the EEG should be read as an interactive whole rather than as isolated frequencies interpreted one at a time. A fast-frequency finding gains or loses meaning depending on what the slower rhythms are doing in the same record.
Autonomic measures deserve the same caution. Reduced reactivity in electrodermal activity, the change in skin conductance produced by sweat gland activity, does not always indicate an absence of anxiety or cortical arousal.
Depression complicates the inference directly because depressive disorders have been associated with lower skin conductance response amplitudes relative to healthy controls (Sarchiapone et al., 2018). A client whose skin conductance stays flat may be depressed rather than calm.
That association matters for how far the arousal argument can be pushed. Concluding that absent electrodermal reactivity proves an absence of cortical arousal, or rules out excess fast beta activity, would outrun the available evidence. The question deserves considerably more study before anyone states such a conclusion as fact.

The Design Problems in a Three-Day Single Case
Start with the subject. She was one child, and she described herself as a habitual breakfast skipper. Her no-breakfast condition was therefore her ordinary morning, while the balanced breakfast was a novel event on a day she knew was being studied. Any difference between those days bundles the meal, the novelty, and her expectations together, making it impossible to determine which one or which combination caused the difference.
The report described no counterbalancing, the practice of varying condition order across sessions so that time and order effects do not masquerade as treatment effects. The three recordings ran across three weeks in a fixed sequence, so calendar time, familiarity with the electrode cap, seasonal change, and school workload all vary alongside the meal. A person’s second and third visits to a laboratory are typically calmer than the first, and calmer usually means less muscle tension.
There is also no within-condition replication. Nothing in the paper tells us how much this child’s high beta varies from one ordinary Tuesday to the next. Without that baseline variability, a 2.9 standard deviation reading has no yardstick. Test-retest reliability for absolute power over a 30-day interval is reasonably good at the group level, but group reliability does not license single-session inference about one person.
The multiple comparison arithmetic deserves attention. Nineteen sites across six frequency bins produce 114 z-score values per recording, meaning 342 across the three maps, where a z-score expresses how many standard deviations a value sits from the reference mean. If a record were perfectly typical, roughly five percent of those comparisons would still exceed the conventional threshold of two standard deviations by chance alone. That is about 17 flagged values across the three maps. The paper reports eight flagged sites in the no-breakfast condition and applies no correction.
Three further gaps matter. The analysis was not blinded, so the electroencephalographer knew which condition he was reading. No blood glucose was measured at any point, which means the study about breakfast never measured the metabolic variable it is about. The anxiety and focus reports came from a post hoc interview with a subject who knew the hypothesis, which is the weakest possible outcome measure.
Three brain maps on three days, in fixed order, on one child who knew the conditions, with no glucose measured, no blinding, and no correction for 342 simultaneous comparisons. Every one of these is fixable. Fixing them is exactly what would turn a suggestive case into stronger evidence of causation.
The Confounds That Ride Along With Breakfast
Caffeine belongs at the top of the list. Siepmann and Kirch (2002) gave 200 milligrams of caffeine, about two cups of coffee, to healthy volunteers in a double-blind crossover and recorded a 17-channel qEEG. Caffeine significantly reduced total EEG power at fronto-parieto-occipital and central sites when the eyes were open. The authors concluded that pharmaco-EEG studies must exclude caffeine as an environmental factor. Orange juice contains none, but energy drinks, large coffees, and pre-workout powders are common among adolescents and rarely self-reported without directed questioning.
The elapsed time between finishing a meal and starting the recording, that is, the postprandial interval, is a variable in its own right. Hoffman and Polich (1998) recorded EEG before and after lunch and found that delta-band power decreased, and both theta and low-alpha power increased after food consumption.
Drowsiness cuts in the opposite direction from hunger. A well-fed child sitting with eyes closed at noon may drift toward sleepiness, which raises theta and lowers alpha without any nutritional mechanism. A hungry child may stay more vigilant and more restless. Both states alter the record, and neither is about nutrition. Hunger also recruits attention, so a child thinking about lunch may be producing an EEG whose results are influenced by the temporary distraction of food-related thoughts.
Sleep and muscle tone round out the list. The case study fixed sleep duration at 8 hours using self-report rather thanactigraphy or polysomnography, and self-reported sleep is an unreliable measure in adolescents. Jaw and forehead tension, as the preceding section showed, can overshadow EEG, especially in the low-amplitude beta and gamma ranges, and obscure important findings. A protocol that does not measure these variables cannot attribute its result to breakfast.
Breakfast never arrives alone. It brings caffeine or its absence, a postprandial interval, a drowsiness gradient, a hunger-driven pull on attention, and a change in jaw and forehead tension. A study that measures none of these cannot assign its result to nutrition.

What a Convincing Study Would Look Like
The good news is that the definitive study is neither expensive nor difficult. Recruit 30 or more healthy children and use a within-subject randomized crossover, so every child experiences every condition in an order determined by chance. Replicate each food condition at least twice per child, which is the only way to estimate how much that child’s spectrum moves for reasons unrelated to food. Fix the interval between the end of the meal and the start of the recording. Blind the electroencephalographer to condition.
Measure the variable the study is about. A capillary glucose value at the moment of recording, or a continuous glucose sensor worn across the protocol, converts a nutritional guess into a physiological covariate. Walk and colleagues (2017) showed how much this matters, since their P3 effect vanished once blood glucose change entered the model. Without glucose data, any breakfast study is really a study of meals in general.
Control the muscle problem explicitly. Record surface EMG from frontalis and temporalis alongside the EEG so myogenic activity can be quantified rather than assumed away (Goncharova et al., 2003). Report how much data survived artifact rejection and what criteria were used. Then analyze the spectrum with a method that separates oscillatory peaks from the aperiodic background, so a broadband shift is not misread as a beta effect (Donoghue et al., 2020).
Finally, behavior and arousal should be measured rather than inferred. A validated anxiety instrument paired with a skin conductance channel is the minimum, since that pairing is what allowed Clarke and colleagues (2013) to test and reject the hyperarousal interpretation. Adding respiration, peripheral skin temperature, or heart rate would give a fuller picture, because no single autonomic channel captures arousal on its own. A prespecified cognitive task also belongs in the protocol, since Pivik and colleagues (2012) and Walk and colleagues (2017) found their effects during mental work rather than at rest. The analysis plan should be preregistered, with use of multiple tests controlled through statistical correction or cluster-based permutation testing.
Thirty children, two recordings per condition, randomized order, a blinded reader, a glucose value at the moment of recording, and an EMG channel. That design costs little and would either confirm a real and clinically useful effect or retire the idea. The field deserves the answer either way.
What This Means in the Clinician's Office
The defensible clinical action here is procedural rather than dietary. The single most useful step is to standardize prandial state, meaning the client’s eating status relative to the recording, and then apply that rule to every baseline and every reassessment. Whether you record clients as fed or fasting matters far less than recording them consistently each time. An uncontrolled variable that shifts between baseline and follow-up will quietly contaminate every comparison you draw.
Add two lines to your qEEG intake worksheet. Record the contents and clock time of the last meal, and the dose and clock time of the last caffeine. This costs seconds and protects years of subsequent comparisons. Ask adolescents about caffeine explicitly and by product name, since energy drinks and pre-workout supplements rarely come up when you ask about coffee.
Treat high beta elevations with extra suspicion before building a protocol around them. Inspect the raw record for jaw clenching and forehead tension. Check whether the topography follows the temporalis and frontalis distributions that Goncharova and colleagues (2003) mapped rather than a plausible cortical pattern. When the picture is ambiguous, coach the client through brief jaw and forehead release and re-record. A muscle artifact that disappears after 60 seconds of relaxation was never a training target.
Be careful what you tell families. The current evidence does not support telling parents that a particular breakfast changed their child’s brainwaves, and that claim invites both false reassurance and unnecessary guilt. Raising the general question of meal regularity with a family is reasonable. Writing a meal plan is not, and it belongs with the child’s physician or a registered dietitian nutritionist. Neurofeedback providers can open the conversation, then refer.
The defensible action here is not dietary. It is procedural. Standardize when your clients eat before a recording, write down what they ate and when, and stop letting an uncontrolled variable walk into every baseline you collect.

Integrative Summary
MacInerney and colleagues (2017) asked a good question and answered it in the only way a single case can, which is provisionally. Their finding that a skipped breakfast raised high beta and a balanced meal normalized it is worth pursuing. It is not yet worth acting on, and the authors said so. Between their question and a clinical recommendation lies a study nobody has done.
The wider literature supports a real but modest relationship between eating and brain electrical activity. Fasting alters low-frequency power during cognitive work in children (Pivik et al., 2012), fasting degrades working memory and early processing in adults (González-Garrido et al., 2019), glucose stabilizes the P3 during attention tasks (Walk et al., 2017), and glucose ingestion shifts theta, alpha, and the aperiodic slope at rest (An et al., 2015; Walker et al., 2021). None of that work implicates resting high beta, and Hoffman and Polich (1998) attributed the food effect to general arousal rather than to a specific cognitive process.
Two facts constrain how far the fuel explanation can stretch. The EEG does not slow until blood glucose falls near 3 mmol/L (Pramming et al., 1988), far below anything a healthy child reaches by missing one meal. Neuronal glucose uptake follows neural activity rather than extracellular concentration, so topping up blood glucose does not straightforwardly raise brain activity (Adolphus et al., 2016).
Arousal, attention, hunger, and hemodynamics are the more plausible mediators.
The measurement problems are the most consequential part of this story for neurofeedback practice. Scalp power above 20 Hz is often contaminated with EMG from muscle activity, and cognitive effort itself recruits cranial muscle (Whitham et al., 2007, 2008). Band power conflates oscillations with the aperiodic background (Donoghue et al., 2020). Excess beta is not an infallible marker of arousal, especially in children with ADHD, since one research group found no autonomic difference between excess beta and excess theta in the children they tested (Clarke et al., 2013).
For healthcare providers, the practical yield is not a breakfast recommendation. It is a reminder that the resting brain map is a fragile measurement made under conditions we usually fail to document. Standardizing eating state, recording what a client consumed and when, and interrogating high beta before training will improve the quality of your data immediately. That improvement requires no new equipment and no new research, only a slightly stricter protocol.
Five Key Takeaways
1. MacInerney and colleagues (2017) reported that skipping breakfast raised high beta in one 12-year-old and that a balanced meal normalized it, a hypothesis-generating result the authors themselves declined to generalize.
2. Studies that have compared fed versus fasting groups have consistently moved delta, theta, and alpha rather than resting high beta, and one well-controlled fasting study found no absolute power differences in any band or region.
3. The EEG responds to glucose, but the threshold for hypoglycemic slowing sits near 3 mmol/L, far below what a healthy child reaches by missing one meal, so arousal and attention are more plausible mediators than fuel supply.
4. Scalp EEG power above 20 Hz can be substantially influenced by EMG generated by muscle activity, and rises with cognitive effort, which makes claims about high beta difficult to defend without EMG controls and aperiodic modeling. Aperiodic modeling, which is recommended but not mandatory, separates the smooth background of an EEG spectrum, summarized by its height and steepness, from the narrow rhythmic peaks that ride on top of it (Donoghue et al., 2020).
5. Excess beta is not an infallible marker of arousal. Although such EEG findings are often associated with elevated anxiety, they still merit further exploration through interviewing or standardized questionnaires.

Appreciation
Dr. Ronald Swatzyna, Director and Chief Scientist of the Houston Neuroscience Brain Center, brought this article he co-authored to our attention. In his Association for Applied Psychophysiology and Biofeedback (AAPB) Distinguished Scientist address, he reminded his audience that the DSM-5 advises that general medical conditions be systematically ruled out before assigning a psychiatric diagnosis to ensure diagnostic validity and appropriate treatment planning. He argued that in abrupt-onset and refractory cases, EEG biomarkers should challenge neurofeedback providers and their medical colleagues to become detectives to identify the causes. This collaborative approach allows each professional to contribute to assessment while "staying in their lane."

Dr. Swatzyna generously mentors professionals in his investigative method, including raw EEG interpretation, to train the next generation of neurofeedback clinicians.
Glossary
absolute power: the amount of electrical energy in a frequency band, expressed in microvolts squared, without reference to activity in other bands.
aperiodic component: the smooth background slope of the EEG power spectrum, which decreases as frequency rises and underlies all oscillatory peaks.
aperiodic modeling: a method that separates an EEG power spectrum into its smooth broadband background, described by an offset and an exponent, and the narrow oscillatory peaks that sit on top of it
artifact: electrical activity recorded by EEG electrodes that arises from something other than brain tissue, such as muscle, eye movement, or line noise.
counterbalancing: varying the order of experimental conditions across sessions or participants so that order and time effects do not mimic treatment effects.
default mode network: a set of interconnected brain regions that is most active during rest and internally directed thought and less active during externally focused tasks.
electroencephalography (EEG): the recording of the brain’s electrical activity from electrodes placed on the scalp.
electromyographic (EMG) contamination: muscle-generated electrical activity, chiefly from scalp, jaw, and neck muscles, that appears in the EEG record.
event-related potential (ERP): a brain response averaged across many trials and time-locked to a specific stimulus or response.
eyes-closed resting condition: a standard recording state in which the participant sits quietly awake with the eyes closed and performs no task.
high beta: EEG activity in roughly the 20 to 30 Hz range, the band most vulnerable to muscle contamination.
hypoglycemia: abnormally low blood glucose, which impairs brain function once the concentration falls far enough.
individual alpha frequency (IAF): the peak frequency of a person’s dominant alpha rhythm, which varies across individuals and states.
linked ears montage: an EEG reference arrangement in which the two earlobe electrodes are joined and serve as the common reference for all scalp channels.
low-voltage fast EEG: a resting pattern in which the posterior dominant rhythm is absent or minimal while faster beta activity is typical or elevated.
N2: a negative ERP component peaking near 200 milliseconds that is associated with attentional inhibition and conflict monitoring.
neuroglycopenia: a state in which the brain’s glucose supply falls below its metabolic demand, producing cognitive and neurological symptoms.
P3 (P300): a positive ERP component peaking near 300 milliseconds that indexes attentional allocation and stimulus evaluation.
posterior dominant rhythm: the alpha-range rhythm recorded over posterior scalp regions during relaxed eyes-closed wakefulness, which normally attenuates when the eyes open.
postprandial: occurring after a meal; the postprandial interval is the elapsed time between finishing food and a subsequent measurement.
prandial state: a person’s eating status at the time of measurement, including whether they have eaten, what they ate, and how long ago.
quantitative electroencephalography (qEEG): the analysis of digitized EEG using spectral methods, often compared against an age-matched normative reference database.
skin conductance level (SCL): the tonic electrical conductance of the skin, a long-established autonomic measure of central nervous system arousal.
skin conductance response amplitude: the size of the brief rise in skin conductance that follows a stimulus, measured in microsiemens from the response onset to its peak.
theta/beta ratio: the ratio of slow theta power to faster beta power, historically proposed as an index of cortical arousal in attention research.
time-frequency analysis: a method that tracks how power in each frequency band changes across the moments of a task rather than averaging across the whole recording.
z-score: a value expressing how many standard deviations a measurement lies from the mean of a reference sample.
References
Adolphus, K., Lawton, C. L., Champ, C. L., & Dye, L. (2016). The effects of breakfast and breakfast composition on cognition in children and adolescents: A systematic review. Advances in Nutrition, 7(3), 590S–612S. https://doi.org/10.3945/an.115.010256
Almeneessier, A. S., BaHammam, A. A., Olaish, A. H., Pandi-Perumal, S. R., Manzar, M. D., & BaHammam, A. S. (2019). Effects of diurnal intermittent fasting on daytime sleepiness reflected by EEG absolute power. Journal of Clinical Neurophysiology, 36(3), 213–219. https://doi.org/10.1097/WNP.0000000000000569
An, Y. J., Jung, K.-Y., Kim, S. M., Lee, C., & Kim, D. W. (2015). Effects of blood glucose levels on resting-state EEG and attention in healthy volunteers. Journal of Clinical Neurophysiology, 32(1), 51–56. https://doi.org/10.1097/WNP.0000000000000119
Barry, R. J., Clarke, A. R., McCarthy, R., Selikowitz, M., Rushby, J. A., & Ploskova, E. (2004). EEG differences in children as a function of resting-state arousal level. Clinical Neurophysiology, 115(2), 402–408. https://doi.org/10.1016/S1388-2457(03)00343-2
Blaabjerg, L., & Juhl, C. B. (2016). Hypoglycemia-induced changes in the electroencephalogram: An overview. Journal of Diabetes Science and Technology, 10(6), 1259–1267. https://doi.org/10.1177/1932296816659744
Clarke, A. R., Barry, R. J., Dupuy, F. E., McCarthy, R., Selikowitz, M., & Johnstone, S. J. (2013). Excess beta activity in the EEG of children with attention-deficit/hyperactivity disorder: A disorder of arousal? International Journal of Psychophysiology, 89(3), 314–319. https://doi.org/10.1016/j.ijpsycho.2013.04.009
Clarke, A. R., Barry, R. J., McCarthy, R., & Selikowitz, M. (2001). Excess beta activity in children with attention-deficit/hyperactivity disorder: An atypical electrophysiological group. Psychiatry Research, 103(2–3), 205–218. https://doi.org/10.1016/S0165-1781(01)00277-3
Donoghue, T., Haller, M., Peterson, E. J., Varma, P., Sebastian, P., Gao, R., Noto, T., Lara, A. H., Wallis, J. D., Knight, R. T., Shestyuk, A., & Voytek, B. (2020). Parameterizing neural power spectra into periodic and aperiodic components. Nature Neuroscience, 23(12), 1655–1665. https://doi.org/10.1038/s41593-020-00744-x
Fulford, J., Varley-Campbell, J. L., & Williams, C. A. (2016). The effect of breakfast versus no breakfast on brain activity in adolescents when performing cognitive tasks, as assessed by fMRI. Nutritional Neuroscience, 19(3), 110–115. https://doi.org/10.1179/1476830515Y.0000000011
Goncharova, I. I., McFarland, D. J., Vaughan, T. M., & Wolpaw, J. R. (2003). EMG contamination of EEG: Spectral and topographical characteristics. Clinical Neurophysiology, 114(9), 1580–1593. https://doi.org/10.1016/S1388-2457(03)00093-2
González-Garrido, A. A., Brofman-Epelbaum, J. J., Gómez-Velázquez, F. R., Balart-Sánchez, S. A., & Ramos-Loyo, J. (2019). Skipping breakfast affects the early steps of cognitive processing: An event-related brain potentials study. Journal of Psychophysiology, 33(2), 109–118. https://doi.org/10.1027/0269-8803/a000214
Hoffman, L. D., & Polich, J. (1998). EEG, ERPs and food consumption. Biological Psychology, 48(2), 139–151. https://doi.org/10.1016/S0301-0511(98)00010-6
Jang, C., Oh, S., Lee, H., Lee, J., Song, I., Park, Y., Lee, E., & Joung, Y. S. (2023). The impact of comorbid anxiety on quantitative EEG heterogeneity in children with attention-deficit/hyperactivity disorder. Frontiers in Psychiatry, 14, 1190713. https://doi.org/10.3389/fpsyt.2023.1190713
MacInerney, E. K., Swatzyna, R. J., Roark, A. J., Gonzalez, B. C., & Kozlowski, G. P. (2017). Breakfast choices influence brainwave activity: Single case study of a 12-year-old female. NeuroRegulation, 4(1), 56–62. https://doi.org/10.15540/nr.4.1.56
Pivik, R. T., Tennal, K. B., Chapman, S. D., & Gu, Y. (2012). Eating breakfast enhances the efficiency of neural networks engaged during mental arithmetic in school-aged children. Physiology & Behavior, 106(4), 548–555. https://doi.org/10.1016/j.physbeh.2012.03.034
Pramming, S., Thorsteinsson, B., Stigsby, B., & Binder, C. (1988). Glycaemic threshold for changes in electroencephalograms during hypoglycaemia in patients with insulin dependent diabetes. British Medical Journal, 296(6623), 665–667. https://doi.org/10.1136/bmj.296.6623.665
Sarchiapone, M., Gramaglia, C., Iosue, M., Carli, V., Mandelli, L., Serretti, A., Marangon, D., & Zeppegno, P. (2018). The association between electrodermal activity, depression and suicidal behaviour: A systematic review and narrative synthesis. BMC Psychiatry, 18, Article 22. https://doi.org/10.1186/s12888-017-1551-4 Schimmelpfennig, J., Topczewski, J., Zajkowski, W., & Jankowiak-Siuda, K. (2023). The role of the salience network in cognitive and affective deficits. Frontiers in Human Neuroscience, 17:1133367. https://doi.org/10.3389/fnhum.2023.1133367
Siepmann, M., & Kirch, W. (2002). Effects of caffeine on topographic quantitative EEG. Neuropsychobiology, 45(3), 161–166. https://doi.org/10.1159/000054958
Walk, A. M., Raine, L. B., Kramer, A. F., Cohen, N. J., Khan, N. A., & Hillman, C. H. (2017). Differential effects of carbohydrates on behavioral and neuroelectric indices of selective attention in preadolescent children. Frontiers in Human Neuroscience, 11, 614. https://doi.org/10.3389/fnhum.2017.00614
Walker, C. P., Buse, J. B., & Frohlich, F. (2021). Experimental increase of blood glucose alters resting state EEG measures of excitation–inhibition balance. Experimental Physiology, 106(4), 803–811. https://doi.org/10.1113/EP089211
Wang, H., Mou, S., Pei, X., Zhang, X., Shen, S., Zhang, J., Shen, X., & Shen, Z. (2025). The power spectrum and functional connectivity characteristics of resting-state EEG in patients with generalized anxiety disorder. Scientific Reports, 15(1), 5991. https://doi.org/10.1038/s41598-025-90362-z
Whitham, E. M., Lewis, T., Pope, K. J., Fitzgibbon, S. P., Clark, C. R., Loveless, S., DeLosAngeles, D., Wallace, A. K., Broberg, M., & Willoughby, J. O. (2008). Thinking activates EMG in scalp electrical recordings. Clinical Neurophysiology, 119(5), 1166–1175. https://doi.org/10.1016/j.clinph.2008.01.024
Whitham, E. M., Pope, K. J., Fitzgibbon, S. P., Lewis, T., Clark, C. R., Loveless, S., Broberg, M., Wallace, A., DeLosAngeles, D., Lillie, P., Hardy, A., Fronsko, R., Pulbrook, A., & Willoughby, J. O. (2007). Scalp electrical recording during paralysis: Quantitative evidence that EEG frequencies above 20 Hz are contaminated by EMG. Clinical Neurophysiology, 118(8), 1877–1888. https://doi.org/10.1016/j.clinph.2007.04.027
About the Author
Fred Shaffer earned his PhD in Psychology from Oklahoma State University. He earned BCIA certifications in Biofeedback and HRV Biofeedback. Fred is an Allen Fellow and Professor of Psychology at Truman State University, where he has taught for 50 years. He is a Biological Psychologist who consults and lectures in heart rate variability biofeedback, Physiological Psychology, and Psychopharmacology. Fred helped to edit Evidence-Based Practice in Biofeedback and Neurofeedback (3rd and 4th eds.) and helps to maintain BCIA's certification programs. He is a recipient of AAPB's Distinguished Scientist Award and BFE's Lifetime Impact Award.

Support Our Friends


Comments