
BCIA Essential Skills: EMG
- BioSource Faculty
- Dec 17, 2022
- 9 min read
Updated: Mar 2, 2024

The surface electromyogram (EMG) is an indispensable tool for evaluating and training clients for chronic pain, headache, hypertension, neuromuscular disorders, optimal performance, and stress. We will cover seven topics in this post: sensor placement, color codes, skin preparation, impedance testing, factors that affect EMG values, bandpass selection, and normal values.
Click on our narrator icon to listen to this post.

Sensor Placement
Clinicians place active electrodes over the target muscle belly (i.e., central region) to record its full voltage. A stronger EMG signal enables an electromyograph to record muscle electrical activity more accurately. Explain muscle palpation and obtain written consent. With a staff member present, palpate the muscle with a gloved hand as it contracts and relaxes to find the muscle belly. Draw circles with a grease pencil to guide sensor placement. Space 0.5-cm active electrodes about 1.5 cm apart. Place the reference electrode within 15 cm of either active. Reference positioning is less critical than active placement.

In the graphic adapted from MYOWARE, compare the signal voltage from the belly with signals from distant sites. Electrodes placed near a muscle's insertion into a tendon or offset to the side reduce EMG signal strength. Likewise, placement over the wrong muscle or at an angle from the muscle belly results in misleading measurements (Sherman, 2002).
Thought Technology Ltd. generously provided the diagrams below from their Basics of Surface Electromyography Applied to Physical Rehabilitation and Biomechanics (2009).


EMG Sensor Color Codes
Note that the color code for active electrodes varies with the manufacturer. For Thought Technology Ltd., the active electrodes are blue and yellow.

For MindMedia, the active electrodes are white and red.
Skin Preparation
We recommend 14 site preparation steps: 1. Select the muscle site you want to monitor. 2. Explain how an EMG sensor operates, site preparation, and sensor attachment procedures. Obtain written permission to monitor your client. 3. Instruct your client to sit or stand. 4. While wearing a glove, palpate the muscle while contracted and relaxed to find the muscle belly. Position the active electrodes over the center of this region for the strongest signal. 5. Draw circles with a grease pencil to guide sensor placement. 6. Space 0.5-centimeter active electrodes about 1.5 centimeters apart. 7. Place the reference electrode within 6 inches of either active. 8. Gently wipe the skin with an alcohol preparation pad to remove oil and dirt. If needed. shave excess body hair.

9. Gently abrade the skin with a pad to remove dead skin. 10. Scoop up a small quantity of gel, like Nuprep, on a cotton swab and gently work it into the skin using small circular motions.

11. Apply EMG sensors to the skin. If the sensor has a floating cup design, apply the adhesive collar before filling the cup with conductive gel. Fill it completely and remove the excess with the collar's backing paper. If the sensor is disposable, press its pre-gelled surface to the skin.

12. Position the electrode cable to minimize discomfort and tension. 13. Tape the cable at several points for strain relief. 14. Instruct your client to minimize movement and confirm their compliance.
Impedance Testing
Measure the quality of skin-electrode contact, which is called impedance. An impedance meter, which sends a nonpolarizing AC signal through the skin, provides the most valid impedance measurement.
In bipolar recording, we measure the impedance between each active electrode and the shared reference. Impedance testing results in two measurements in the Kohm (thousand-ohm) range. An impedance test can be performed manually with a separate impedance meter or voltohmmeter or automatically.

A MyoScan-Z sensor allows automatic impedance testing.

BioGraph Infiniti software performs an impedance test.

Low and balanced skin-electrode impedances are critical. A conservative rule is that each measurement should be less than 10 Kohms and within 5 Kohms of each other.
Why? Two reasons. First, high skin-electrode impedance reduces SEMG signal strength and makes it harder to differentiate from contamination.
Second, a differential amplifier subtracts voltages that look identical because they are probably artifacts like 50/60Hz. Imbalanced impedance makes voltages look different (the signal with higher impedance will appear smaller), allowing artifacts to "sneak" through.
Inadequate skin preparation and the application of insufficient electroconductive gel can produce high and imbalanced impedances. Impedance imbalance can lower SEMG values and the signal-to-noise ratio and increase signal contamination.
This problem is illustrated by the recording shown below, adapted from Peper, Gibney, Tylova, Harvey, and Combatalade (2008).

Revised caption: Recording of electrode contact artifact. When the trainee tried to relax, SEMG activity never dropped near zero due to poor skin/electrode contact. After applying electroconductive gel and the Triode™ electrode was reattached to the trainee’s non-dominant arm, the skin/electrode contact improved. The signal dropped to near zero during relaxation and appropriately increased during tension.
Sherman (2002) cautions that high impedance due to poor skin preparation can make a highly-contracted muscle look virtually silent by reducing its amplitude to one-tenth of its actual value.
Perform a Tracking Test
Performing a tracking test, you can determine whether a SEMG display mirrors your client's muscle contraction. You instruct your client to contract and then briefly relax the monitored muscles.
For example, for a frontal placement over the forehead, you might instruct your client, "Please gently tighten the muscles in your forehead for a few seconds and then allow them to relax." The integrated SEMG signal should increase during the contraction phase and decrease during the relaxation phase.
Below is a BioGraph ® Infiniti SEMG tracking test display in which the client briefly contracts and relaxes the frontales muscles.
Factors that Affect EMG Values
Whereas two different feedback thermometers should register the same room temperature, we can't assume the same for two electromyographs' measurements of SEMG voltage.
SEMG amplitude is a relative measurement of skeletal muscle electrical activity because it depends upon a surprising number of factors, some controllable and others intrinsic to your client or electromyography. For example, adipose tissue filters the SEMG signal and reduces its amplitude. Consider your client's subcutaneous fat when interpreting SEMG measurements from different sites on the same individual or the same location between individuals (Shaffer & Neblett, 2010).

The relativity of SEMG voltages characterizes all biofeedback modalities. Temperatures are no more absolute than SEMG values. When you attach a temperature probe to a client, factors like cold exposure before entering the clinic, stabilization period, sensor placement, task, and your relationship with the client can greatly affect temperature readings. All psychophysiological measurements are affected by hardware, environmental, procedural, and client factors. Experienced clinicians and researchers manipulate controllable factors and standardize those not controllable to increase measurement validity.
A reading of 5 μV obtained from one electromyograph could easily be 8 μV on another due to different bandpasses and integration methods. In contrast, temperature measurements are absolute because two feedback thermometers should register the same room temperature.
To compare SEMG values across session pre-baselines, standardize the electrodes, placement, skin-electrode impedance, baseline conditions, location in the room, bandpass and notch filter settings, and rectification and integration methods.
Bandpass Selection
A bandpass filter combines two filters called high-pass and low-pass filters. A high-pass filter selects frequencies above a cutoff. In contrast, a low-pass filter selects frequencies below a cutoff.
When you combine high-pass and low-pass filters, this selects signals between the upper and lower cutoffs. We call this region the bandpass.
For example, the 100-200 Hz bandpass filter commonly used in electromyographs combines a 100-Hz high-pass filter and a 200-Hz low-pass filter.
The bandpass filter's bandwidth is the 100-Hz difference between the high-pass and low-pass frequencies (200 Hz-100 Hz).
A bandpass filter is defined by its center frequency, cutoff frequencies, and slope.
The center frequency lies in the middle of the bandpass. For a 100-500 Hz bandpass filter, the center frequency is 300 Hz. Send a 300-Hz signal into this filter, and 100% will reach the next stage.
Cutoff or corner frequencies are the points where voltage is reduced to 0.707 of its initial strength. For a 100-500 Hz bandpass filter, the cutoffs are 100 Hz and 500 Hz. Send a 100-Hz signal into this filter, and only 71% will get through. This graphic was adapted from Peek (2016).

Caption: This diagram shows a 100-500 Hz bandpass superimposed on a 10-1000 Hz surface EMG spectrum. A 58-62 Hz notch filter is shown in red. The left and right borders of the 100-500 Hz bandpass are their cutoff frequencies.
How to Select the Right Bandpass
Electromyographs can process frequencies from 20-1000 Hz. Most signal power lies below 200 Hz; 80% of power ranges from 30-80 Hz. There is minimal power above 500 Hz (Bolek, Rosenthal, & Sherman, 2016; Cram, 1991).
You can select a bandpass by a switch on stand-alone electromyographs and in the sensor housing or software on data acquisition systems.
Two choices are narrow (100-200 Hz) or wide (20-500 Hz) bandpasses. The actual ranges will differ across manufacturers.
Consider a narrow bandpass when there are high environmental noise levels or when nearby muscles contaminate the measurement of the muscle you're monitoring. A narrow bandpass will result in lower SEMG values than a wide bandpass (Peek, 2016). Select a wide bandpass when noise is acceptable.
Use a wide bandpass when artifact and muscle cross-talk are not problems. Under ideal conditions, a wide bandpass will more accurately represent SEMG activity.
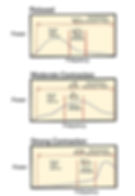
Wide bandpasses can better measure proportional increases in muscle contraction than narrow bandpasses (Sherman, 2002). Wide bandpasses measure SEMG activity more accurately because greater muscle contraction recruits more motor units and more fast-twitch fibers, increasing the amount of signal power in the higher frequencies.
While a wide bandpass can easily detect an increase in power in the 200-500 Hz range, a narrow bandpass can be insensitive to this change because it attenuates frequencies over 200 Hz.
As a client moves from muscle relaxation to strong contraction in the diagram below, a wide bandpass shows an increase from 2 to 9 microvolts, while a narrow bandpass only shows an increase from 1 to 2 microvolts. Diagram adapted from Sherman (2002).
Normal Resting Values
Khazan (2019) has described average relaxed SEMG values while clients sit quietly without feedback or instructions. Large muscles (e.g., trapezius) should be less than 5 μV, while small-to-moderate-size muscles (e.g., frontales) should be under 3 μV. Clinicians may attempt to down-train SEMG activity to below 1 µV (Khazan, 2013, pp. 45, 143).
Summary
Clinicians should place active EMG sensors over the muscle belly to record a muscle's full voltage. The color convention for active and reference electrodes varies across manufacturers. Careful skin preparation ensures good skin-electrode impedance. They manually or automatically perform impedance measurements to ensure low and balanced values. They perform a tracking test to confirm that EMG voltage changes mirror muscle contraction and relaxation. Clinicians should recognize the diverse factors influencing EMG values, including adiposity and bandpass. They should know the typical values for large and small-to-moderately-sized muscles during resting baseline conditions.
Quiz
Take a five-question exam on Quiz Maker to test your mastery.
Glossary
active electrode: the electrode placed over the belly of a target muscle.
bandpass: a filter that combines a low-pass filter and high-pass filter.
bandpass filter: an electronic device that combines a low-pass filter and high-pass filter to transmit frequencies within a specific range and attenuate those outside that range, such as a 100-200 Hz bandpass filter.
bandwidth: the difference between a filter’s lower and upper cutoff frequencies. The bandwidth of a 100-200 Hz bandpass filter is 100 Hz.
bipolar recording: EMG recording using two active and one reference electrode.
electromyography (EMG): an instrument that measures the muscle action potentials that initiate skeletal muscle contraction
muscle belly: a muscle's central region.
muscle electrical activity: the muscle action potentials that trigger skeletal muscle contraction; EMG voltage.
palpation: a procedure in which a client contracts and relaxes a muscle while a clinician locates the muscle belly by touch.
reference electrode: an electrode placed within 15 cm of either active electrode.
tracking test: a check whether a biofeedback display mirrors client behavior. SEMG amplitude should rise when your client contracts a monitored muscle.
References
Bolek, J. E., Rosenthal, R. L., & Sherman, R. A. (2016), Advanced topics in surface electromyography. In M. S. Schwartz and F. Andrasik (Eds.). Biofeedback: A practitioner’s guide (4th ed.). The Guilford Press. Cram, J. (1991). Clinical EMG for surface recordings: Vol. 2. Clinical Resources. Florimond, V. (2009). Basics of surface electromyography applied to physical rehabilitation and biomechanics. Thought Technology Ltd.
Khazan, I. (2013). The clinical handbook of biofeedback: A step-by-step guide for training and practice with mindfulness. John Wiley & Sons, Ltd.
Khazan, I. (2019). Biofeedback and mindfulness in everyday life. W. W. Norton & Company.
Peek, C. J. (2016). A primer of traditional biofeedback instrumentation. In M. S. Schwartz, & F. Andrasik (Eds.). Biofeedback: A practitioner's guide (4th ed.). The Guilford Press.
Peper, E., Gibney, K. H., Tylova, H., Harvey, R., & Combatalade, D. (2008). Biofeedback mastery: An experiential teaching and self-training manual. Association for Applied Psychophysiology and Biofeedback.
Shaffer, F., & Neblett, R. (2010, Summer). Practical anatomy and physiology: The skeletal muscle system. Biofeedback, 38(2) 47-51.
Sherman, R. (2002). Hooray! The revolution is here! (But don't stop it in its tracks). Biofeedback, 30(1), 7, 18.
Stern, R. M., Ray, W. J., & Quigley, K. S. (2001). Psychophysiological recording (2nd ed.). Oxford University Press.
Tassinary, L. G., Cacioppo, J. T., & Vanman, E. J. (2007). The skeletomotor system: Surface electromyography. In J. T. Cacioppo, L. G. Tassinary, & G. G. Berntson, (Eds.). Handbook of psychophysiology (3rd ed.). Cambridge University Press.
Feedback

We value your feedback because we produce these posts for you. Please complete our brief survey to help us improve this service.
Learn More

