
Best Practice: Researcher Claims
- BioSource Faculty
- Jun 4, 2025
- 24 min read
Updated: Jun 5, 2025

We have based our Best Practice series on Dr. Beth Morling's Research Methods in Psychology (5th ed.). We encourage you to purchase it for your bookshelf. If you teach research methods, consider adopting this best-of-class text for your classes.
Dr. Beth Morling is a distinguished Fulbright scholar and was honored as the 2014 Professor of the Year by the Carnegie Foundation for the Advancement of Teaching.

With more than two decades of experience as a researcher and professor of research methods, she is an internationally recognized expert and a passionate advocate for the Research Methods course. Morling's primary objective is to empower students to become discerning critical thinkers, capable of evaluating research and claims presented in the media.

In this post, we will explore a question addressed in Chapter 3: "Which claims do researchers make?"

We will explain how psychological researchers make and evaluate three major types of claims: frequency, association, and causal. We will distinguish these claims by their structure, required evidence, and implications for understanding human behavior. You will learn how to identify the type of claim being made, assess whether the supporting methodology matches the claim’s strength, and recognize when claims are overstated or unsupported. Finally, we will address how association claims support prediction, the role of scatterplots in visualizing relationships, and the importance of distinguishing research-based conclusions from anecdotal reports.
Three Claims
In psychological research, a claim is an assertion about the state of the world, often based on data collected in a study. There are three major types of claims that researchers and journalists make: frequency claims, association claims, and causal claims. A frequency claim is a statement about how common or prevalent a particular variable is. For example, “Twenty-one percent of Canadian adolescents aged 15–17 reported vaping in the last month” is a frequency claim because it provides a numerical estimate of a single measured variable.
An association claim makes a statement about the relationship between two variables, such as “Playing an instrument is linked to better cognition.” This type of claim indicates that the variables covary, meaning that changes in one variable tend to accompany changes in the other.
Finally, a causal claim goes a step further and asserts that one variable directly causes a change in another, as in “Pretending to be Batman helps kids stay on task.” To support such a claim, a study must meet stricter methodological requirements.
Understanding the differences between these three claims is essential for evaluating research. Frequency claims only involve one variable and describe its level in a population. These claims can usually be supported with descriptive statistics drawn from survey or observational data. Association claims involve at least two measured variables and describe the strength and direction of their relationship. For example, higher hours of sleep might be associated with lower levels of stress. These are typically supported by correlational studies, which examine natural variations between variables without manipulating them. Causal claims, on the other hand, require experimental evidence, including random assignment to different levels of a manipulated variable, to ensure internal validity.
Each type of claim uses distinct language. Frequency claims often include terms like “percentage,” “majority,” or “average.” Association claims may include words like “linked,” “correlated,” “associated,” or “tied to.” Causal claims use language that implies one variable influences another, with verbs like “causes,” “leads to,” “reduces,” or “prevents.” When reading research summaries or media headlines, learning to recognize these cues can help you determine what kind of claim is being made—and what kind of evidence is needed to support it.
It’s also important to avoid confusing these types of claims.
Sometimes, researchers or journalists overstate their findings. They might report a correlational study but make a causal claim.
For instance, if a study finds that children who eat more vegetables also do better in school, that’s an association claim. But if someone reports that eating vegetables makes kids smarter, they’ve made a causal claim that may not be supported by the evidence. Knowing the difference helps you avoid being misled by overinterpretation or poor reporting.
These claim types form the foundation of psychological research communication. Whether you're reading a scientific journal, interpreting a survey, or hearing a media report, identifying the kind of claim being made is the first step in evaluating it. Once you’ve identified the claim, you can start asking the right questions: Was the right method used to support the claim? Are the variables clearly defined and measured? Does the evidence match the strength of the claim? This approach keeps you grounded in scientific thinking.
In sum, the three types of claims—frequency, association, and causal—differ in what they assert and in the type of research needed to support them. Frequency claims require a well-defined measure of a single variable. Association claims require reliable measurements of two or more variables and an analysis of their relationship. Causal claims require the most rigorous standards, including manipulation, random assignment, and control of confounds. Learning to classify claims correctly is a foundational skill in psychological science, and it sets the stage for everything else you’ll learn about evaluating and conducting research.
Frequency Claims
A frequency claim describes a particular rate or level of a single variable in a defined group of people. It tells us how common or widespread something is, without linking it to any other variable. For example, the statement “21% of Canadian adolescents aged 15–17 reported vaping in the last month” is a frequency claim because it focuses solely on the proportion of teens who vape. Other examples include “30% of students report feeling stressed every day” or “The average adult sleeps 6.8 hours per night.”
These kinds of claims are based on data gathered from surveys, polls, or observational studies where only one variable is being measured. Importantly, frequency claims do not tell us why something is happening or whether it is related to other variables—they simply describe.
To support a frequency claim, researchers must carefully define the variable being measured and use appropriate methods for collecting data. The construct validity of the measure is crucial here.
For example, how is “stress” defined? Is it measured with a single question, a multi-item questionnaire, or a physiological indicator like cortisol level? The quality of the measure affects whether we can trust the result. Additionally, researchers must ensure that their measurements are consistent (reliable) and valid—that is, they actually capture what they’re intended to measure.
External validity is also essential when evaluating a frequency claim. External validity refers to how well the findings can be generalized to a larger population. For example, if researchers claim that 73% of the world laughed yesterday, we must ask: Who was included in their study? Was the sample representative of the global population? Did it include people from different regions, cultures, age groups, and socioeconomic backgrounds? If not, the claim might not be generalizable, even if the number is precise.
A well-conducted study supporting a frequency claim uses random sampling and includes participants who reflect the diversity of the population the researchers want to generalize to.
Statistical validity also matters. This includes the margin of error or confidence interval around the percentage reported. For instance, a claim that 39% of teens text while driving might come with a margin of error of ±2%. This tells us that the true value in the population is likely between 37% and 41%. Understanding these ranges helps us interpret the reliability of the point estimate. Moreover, replication strengthens statistical validity. If multiple studies using different samples report similar frequency estimates, our confidence in the result increases.
Frequency claims are often seen in news stories and health reports. However, just because a number is presented doesn’t mean it’s accurate. As a reader, you should ask: What was the method? How was the variable defined? Who was surveyed? How large was the sample? What is the margin of error? These questions will help you determine whether a frequency claim is well-supported or just headline fluff.
To sum up, frequency claims provide useful snapshots of how common certain behaviors, beliefs, or experiences are in a population. They rely on good measurement, careful sampling, and clear statistical reporting. They are not about relationships between variables or cause-and-effect explanations—they are about describing the world as it is. As a psychology student, learning to interpret frequency claims is one of the first steps in becoming a scientifically literate consumer of information.
Association Claims
Association claims describe a relationship between two measured variables, indicating that they covary—that is, when one variable changes, the other tends to change too. An example of an association claim is “Playing an instrument is linked to better cognition.” This suggests that people who play instruments tend to have higher cognitive scores than those who don’t. Importantly, association claims do not imply causation. The phrase “is linked to” or “is associated with” signals that researchers found a correlation, not that one variable directly caused the other to change.
Association claims are typically supported by correlational studies, where both variables are measured rather than manipulated. These types of claims are very common in psychological research and help identify patterns that can guide further inquiry.
To support an association claim, researchers must measure both variables clearly and reliably. Construct validity is key—how well did the researchers measure the variables involved? If a study claims that social media use is associated with anxiety, we need to know how each was measured. Did participants self-report their screen time? Was anxiety assessed through a validated scale?
Weak measurement can lead to misleading conclusions, so evaluating the operational definitions used in the study is critical. Researchers also need to ensure that the data they collected are appropriate for analyzing correlations, which means both variables must have variability and be suited for comparison.
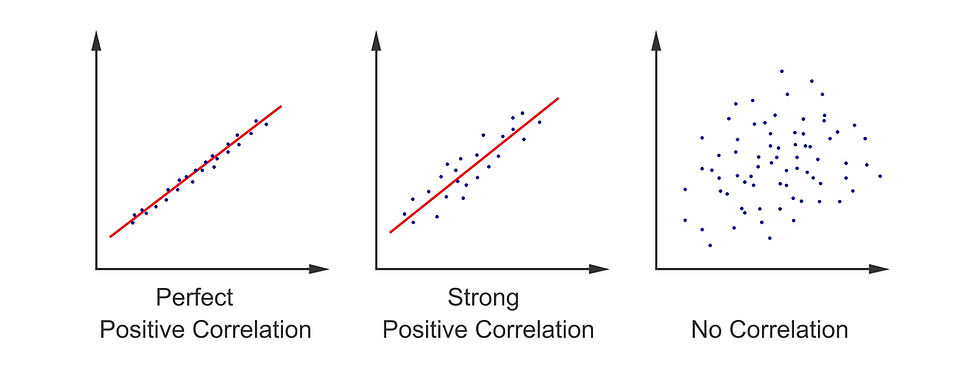
Association claims come in three basic forms: positive, negative, and zero associations. A positive association means that high levels of one variable go with high levels of another, like more exercise being linked to better mood. A negative association means that high levels of one variable go with low levels of another—for instance, more screen time being linked to lower sleep quality. A zero association means that there is no systematic relationship between the two variables; knowing the level of one doesn’t help you predict the other. These relationships are often visualized using scatterplots, which help researchers see the pattern of data points and assess the strength and direction of the association.
Statistical validity plays a major role in evaluating association claims. You want to ask: How strong is the correlation? Is the effect statistically significant? What is the confidence interval for the association? Are the results likely to replicate? These questions help you decide whether the observed relationship is meaningful and trustworthy. Strong associations provide better predictive power, while weak associations may be less useful or more prone to error. Additionally, statistical tests can help determine whether the observed association could have happened by chance.
External validity also matters for association claims. Can the findings be generalized to other populations or settings? For example, if a study found that meditation is associated with lower anxiety in college students, can we generalize that finding to older adults or people in high-stress professions? The representativeness of the sample and the settings in which the study was conducted affect how broadly we can apply the results. Studies that use diverse and representative samples are more likely to yield findings that apply across different contexts.
Association claims are foundational to psychological research because they help us identify variables that are connected and warrant further investigation. While they cannot prove causality, they provide essential groundwork for asking deeper questions.
If two variables are consistently associated, researchers may decide to conduct experiments to explore whether a causal relationship exists. Understanding how to identify, interpret, and critique association claims is crucial for anyone studying psychology or consuming psychological research.
Positive Association
A positive association refers to a relationship between two variables where high values on one variable tend to go with high values on the other, and low values go with low. For example, imagine a study that finds the more hours students spend studying, the higher their test scores tend to be. This is a positive association. As one variable increases, so does the other. This relationship can also work in reverse—less studying tends to go with lower test scores. In scatterplots, a positive association is illustrated by a line that slopes upward from left to right, showing that increases in one variable correspond with increases in the other. Positive associations help us make predictions; if we know someone exercises frequently, and we know exercise is positively associated with better mood, we might predict that this person tends to have a more positive mood.
Positive associations are extremely common in psychology and related fields. They help us discover trends such as “higher social support is associated with better mental health” or “greater mindfulness practice is associated with reduced stress.” However, a positive association does not necessarily mean that one variable causes the other. For instance, while it's true that people who sleep more tend to feel more rested, that does not mean simply increasing your hours in bed will always lead to better sleep. Other factors might be involved, such as sleep quality, health conditions, or stress levels. Recognizing the direction and strength of the association is useful, but without an experimental design, we can't draw a causal conclusion.
The strength of a positive association varies depending on how closely the variables track each other. If the dots on a scatterplot cluster tightly along a straight upward line, the association is strong. If the dots are more scattered but still generally follow an upward slope, the association is weaker. Positive scatterplot graphic © Andrii Ablohin/Shutterstock.com.
In psychological research, even a modest positive association can be meaningful—especially when supported by other studies and theoretical reasoning. Stronger associations are more likely to be statistically significant and more useful for making predictions, though even weaker ones can inform policy or clinical decisions.
Positive associations can also vary across populations or contexts. For example, a study might find that exercise is positively associated with mood among young adults, but not among older adults, or only among those who exercise in social settings. This is why it's important to ask questions about external validity when evaluating association claims. Do the findings generalize to the population or context you care about? Were the participants diverse, or drawn from a narrow group such as college students? External validity helps determine whether the observed positive association is broadly applicable.
One common mistake is assuming that a positive association must be linear—that is, a straight-line relationship where changes are constant. But not all positive associations are linear.
For instance, moderate caffeine intake might be associated with increased alertness, but too much caffeine might reduce alertness by causing jitteriness. This creates a curvilinear relationship—still positive at lower levels, but not across the entire range. Researchers must examine their data to determine whether the relationship fits a straight line or requires a more complex model.
Understanding positive associations gives you a powerful tool for interpreting psychological research and applying it to real-world questions. When you see a study reporting that X is positively associated with Y, think about how strong that association is, whether the measures were valid, and whether other variables could explain the pattern. Ask whether the finding makes sense in light of prior research and whether it could inform further study or practical applications. Being able to recognize and critically evaluate positive associations will strengthen your scientific literacy and help you become a more discerning consumer and producer of psychological research.
Negative Association
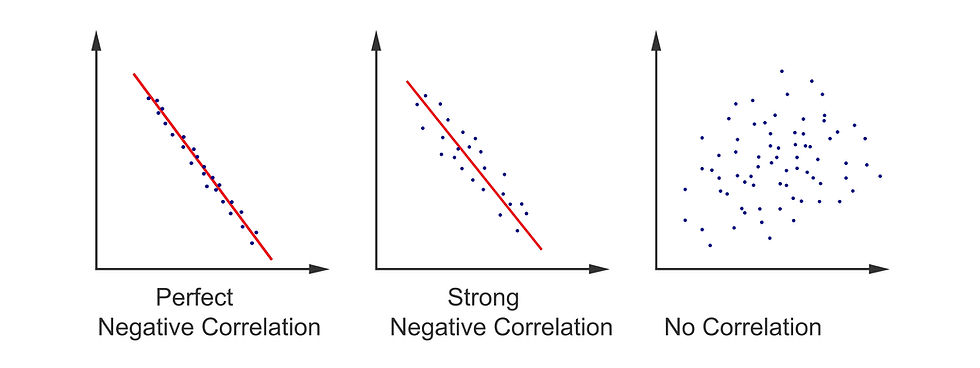
A negative association occurs when high values on one variable tend to go with low values on another variable, and vice versa. This means that as one variable increases, the other tends to decrease. For example, imagine a study that finds the more time teens spend on social media, the lower their reported levels of self-esteem. This relationship is negative because higher screen time is associated with lower self-esteem.
In a scatterplot, a negative association is shown as a downward-sloping line from left to right. This indicates that as values on one axis rise, the values on the other axis tend to fall. Negative scatterplot graphic © Andrii Ablohin/Shutterstock.com
Negative associations are very important in psychology because they often point to risk factors or problematic behaviors. When we observe negative associations, it can lead us to ask why these variables are inversely related, and what interventions might help.
It’s crucial to remember that just like with positive associations, a negative association does not prove causation. For instance, we might see a negative correlation between exercise frequency and symptoms of depression. While it’s tempting to say that exercise reduces depression, this claim requires experimental evidence. It’s possible that people who are less depressed are more motivated to exercise, or that a third factor—like having more free time or access to facilities—explains both.
Thus, recognizing a negative association is just the starting point for deeper investigation. It signals a pattern worth exploring, but not a conclusion about what’s causing what.
Negative associations can also vary in strength. A strong negative association means that the variables move in opposite directions in a highly predictable way. In a scatterplot, this would look like a tight cluster of points following a steep downward line. A weaker association would show more variability but still a general downward trend. Even a weak negative association can be meaningful, especially in fields like public health or education where small effects across large populations can matter. As with positive associations, the strength and direction of the relationship should be supported by clear statistical analysis and careful measurement.
External validity is also important in evaluating negative associations. Suppose a study finds that sleep deprivation is negatively associated with academic performance in college students. Can we generalize this result to high school students? To working adults taking night classes? Understanding the sample used in the study and the context in which the data were collected helps us assess whether the observed pattern applies elsewhere. Replication in different populations and settings helps confirm whether a negative association is robust and reliable.
It’s also worth noting that some negative associations can be counterintuitive. For example, a study might find that more parental supervision is negatively associated with teen autonomy. While this makes statistical sense—more control leads to less independence—it may not reflect a simple or undesirable relationship. Context matters. Some variables have non-linear or curvilinear relationships, where the association may be negative only within certain ranges. For example, a small amount of stress may improve performance, but too much may impair it, resulting in a complex association pattern that researchers must model carefully.
In conclusion, recognizing negative associations allows us to identify potentially harmful patterns or risk factors. But we must always ask critical questions: Were the variables measured accurately? Was the sample representative? Could a third variable explain the relationship? Is the pattern replicable across different groups? These questions help ensure that we interpret negative associations with the nuance and skepticism that scientific thinking demands. Just like with positive associations, our goal is to understand—not just to observe—and negative associations often provide valuable insights into how behaviors and mental states interact in the real world.
Zero Association
A zero association refers to a situation where two variables are not related in any systematic way. That means knowing the value of one variable tells you nothing about the value of the other. For example, imagine a study that finds no relationship between how many video games a person plays and their level of happiness. People who play a lot of video games may be just as happy—or unhappy—as those who play none. In a scatterplot, a zero association appears as a cloud of data points without any discernible slope or direction. The data look random, with no upward or downward pattern. This suggests that the variables are statistically independent.
Zero associations are just as informative as positive or negative associations, though they’re sometimes underappreciated. When researchers expect a relationship between two variables and find none, this result can help refine theories or redirect research. For instance, if researchers hypothesize that multitasking improves productivity but find no association, they must revisit their assumptions and explore other possibilities. Similarly, public misconceptions can be addressed through zero associations. If many people believe that listening to classical music increases intelligence, but research consistently shows no link, a zero association helps correct the narrative.
It’s important to distinguish a true zero association from a weak one. A truly zero association means there is no meaningful relationship at all. A weak association might show a very small pattern, which could be real but difficult to detect in smaller samples.
Researchers use statistical tools like correlation coefficients and p-values to determine whether an apparent lack of association is meaningful or just the result of noise. A correlation close to 0.00 often signals a zero association, but the context and sample size must also be considered.
As with other associations, construct validity and measurement reliability matter here. If either variable is poorly measured, researchers might miss a real relationship and mistakenly report a zero association. For example, if happiness is measured with a vague, single-item question and gaming is self-reported imprecisely, it’s possible that a weak but real relationship could be obscured. That’s why precision in operational definitions is essential, even when the results appear null. The accuracy of measurement tools directly impacts whether a study can detect subtle patterns—or determine that none exist.
Zero associations also raise questions about statistical and external validity. Is the sample size large enough to detect a relationship if one exists? Are the findings consistent across subgroups or repeated in other populations? Has the study been replicated? If the same null result shows up in multiple well-designed studies, we can be more confident that there really is no link between the variables. A single study, particularly one with a small sample or imprecise measures, is not enough to declare a zero association.
In summary, zero associations are a valuable part of the research landscape. They tell us where relationships do not exist, helping to refine theories, debunk myths, and focus attention on variables that do matter. While it may seem less exciting than discovering a significant association, ruling out incorrect assumptions is a core function of science. By recognizing and interpreting zero associations correctly, you become a more discerning consumer of research and contribute to the broader goal of building accurate and reliable psychological knowledge.
Making Predictions Based on Associations
One of the key practical uses of association claims in psychology is their ability to support predictions. When two variables are associated—positively or negatively—we can use knowledge of one variable to make a guess about the other. For example, if a study finds a positive association between the number of hours studied and exam performance, then knowing how much a student studied allows us to make a reasonable prediction about how well they might score. Similarly, if there is a negative association between stress and sleep quality, then knowing someone is highly stressed might lead us to predict that they aren’t sleeping well. These predictions are probabilistic, not perfect—they help improve the accuracy of our expectations, but they don't guarantee an outcome.
The stronger the association, the more accurate our predictions can be. This is because a strong correlation suggests that the variables tend to move together in a consistent pattern. If the correlation is weak, our predictions are less precise because the relationship is more variable.
For example, a correlation of r = .60 between two variables indicates a fairly strong association and allows for better predictions than a correlation of r = .10. That doesn’t mean the prediction will be right every time, but it’s more likely to be correct than guessing without any data at all. Understanding the strength and direction of associations helps researchers, clinicians, and even educators make informed decisions.
However, it’s important to remember that predictions based on associations do not imply causality. Just because one variable can help predict another doesn’t mean that it causes it. Consider a study finding that children who eat more green vegetables tend to have higher reading scores. While this may allow for a prediction—kids eating more greens might score better—it doesn’t mean the vegetables caused better reading skills. Other variables, like parental involvement or general nutrition, could be influencing both. When using associations to make predictions, we must be cautious not to overinterpret the data.
Predictions from associations are especially useful in applied psychology. For example, in clinical psychology, knowing that higher scores on an anxiety inventory are associated with more frequent panic attacks can help therapists anticipate which clients might need more intensive support. In industrial-organizational psychology, associations between job satisfaction and employee turnover can guide HR strategies. These predictions are tools for planning and intervention—they guide actions based on trends observed in data, even if we don’t fully understand the causal mechanisms behind them.
Prediction also plays a central role in hypothesis generation. When researchers observe an association, they can use it to build a theory about how and why the variables are related. These theories can then be tested through further research, including experiments designed to explore causation. This is how science progresses—from noticing patterns to testing predictions to uncovering deeper insights. Every accurate prediction based on a correlation sets the stage for more rigorous investigation, and sometimes for meaningful change in policy, practice, or treatment.
In conclusion, association claims offer a powerful basis for making informed predictions. Whether the association is positive, negative, or weak, understanding the relationship between variables allows researchers and practitioners to anticipate outcomes and refine their approaches. But the predictive power of associations depends on accurate measurement, representative sampling, and an awareness of the limitations of correlation. Predictions are probabilistic estimates, not guarantees—and their value lies in how they help us make better decisions, generate new research questions, and move toward a more complete understanding of human behavior.
Causal Claims
Causal claims are the strongest type of claim in psychological research because they assert that one variable is responsible for changing another. These claims go beyond simply stating that two variables are related—they argue that the relationship is directional and that changes in one variable lead to changes in the other. For example, a causal claim might state that “pretending to be Batman helps children persist longer on a task,” or “taking a deep breath reduces anxiety.” Such claims suggest a cause-and-effect relationship and must meet a higher standard of evidence than frequency or association claims. The language used in causal claims usually includes verbs like causes, affects, increases, decreases, prevents, or leads to, which signals that the researcher or journalist is asserting causation rather than just correlation.
To support a causal claim, a study must meet three critical criteria: covariance, temporal precedence, and internal validity.
Covariance means that the two variables must be shown to be related—if there’s no association at all, then there’s nothing to explain causally. Temporal precedence means that the causal variable must come first in time, before the effect variable. Internal validity means ruling out other explanations or confounding variables that might account for the observed relationship. For instance, if we want to claim that exercise reduces depression, we need to ensure that exercise happened before the change in mood and that some third factor—like social support or diet—isn’t actually responsible for the observed improvement.
The gold standard for establishing causation is the true experiment. In a true experiment, researchers manipulate one variable (the independent variable) and measure the effect on another variable (the dependent variable). Participants are randomly assigned to different conditions, which helps control for confounding variables and strengthens internal validity. For example, in the study by Rachel White and colleagues, children were randomly assigned to pretend to be a superhero, refer to themselves in the third person, or use the first person while completing a boring task. This manipulation allowed the researchers to conclude that pretending to be Batman (the manipulated variable) caused greater persistence on the task (the measured variable).
Experiments like these not only establish causation but also help develop psychological theory. If we observe that a certain manipulation consistently produces a specific outcome, we can begin to explore why. In the Batman study, researchers hypothesized that “self-distancing”—the act of stepping outside oneself and viewing the situation from another perspective—was the mechanism responsible for the effect. The experiment supported this idea, and future studies can build on it by testing variations, such as pretending to be other characters or applying the method to different age groups or tasks.
However, not all causal claims are supported by experiments, and sometimes journalists or researchers overreach. A study might observe that people who eat more fiber have lower rates of heart disease, and a headline might say “Fiber prevents heart disease.” But if the study was correlational, this is a misinterpretation. Without random assignment and manipulation, we can’t rule out third variables or confirm the direction of the effect. It’s essential to be cautious when interpreting causal language in media or research summaries. When in doubt, ask: Was this study experimental? Were participants randomly assigned? Was the independent variable manipulated?
In sum, causal claims are powerful but require rigorous evidence. They must demonstrate a reliable association (covariance), establish that the cause comes before the effect (temporal precedence), and rule out other possible explanations (internal validity). Only experimental designs with random assignment and strong controls can meet these criteria. Understanding these requirements helps protect you from being misled by overconfident headlines and equips you to design studies that provide valid answers to cause-and-effect questions in psychology. As you evaluate or produce research, always remember: correlation alone is not enough to claim causation—only a well-conducted experiment can make that leap with confidence.
Not All Claims Are Based on Research
As you become more skilled in evaluating psychological claims, it’s essential to remember that not everything presented in the media or even in professional conversations qualifies as a research-based claim. Some headlines, articles, and conversations are based on anecdotes, opinion pieces, interviews, or speculative essays. These can be interesting and even thought-provoking, but they are not scientific claims unless they’re grounded in empirical evidence. For instance, a headline like “What My Psychotic Break Felt Like” might offer valuable personal insight, but it doesn’t provide generalizable data or support a frequency, association, or causal claim. Instead, it represents a narrative—one person’s subjective experience.
Sometimes, people blur the lines between personal experience and research. An article might describe someone’s experience with anxiety during the pandemic and draw broader conclusions without presenting any systematic data. When consuming content like this, it's helpful to pause and ask: What kind of claim is being made? Is this based on data or on a single case? While personal stories can highlight important psychological issues and inspire future research, they cannot by themselves establish prevalence rates, statistical trends, or causal relationships.
This distinction becomes especially important in journalistic and popular psychology writing. Articles may reference “new findings” without actually presenting or citing empirical data. For example, a blog post that states “brown noise helps people with ADHD focus” may be relying on user anecdotes or informal polls rather than published studies. Without details about sample size, measurement, and statistical analysis, the claim remains anecdotal. It may be worth investigating further, but it should not be treated as a scientific conclusion until it's backed by peer-reviewed research.
Being able to recognize what is and isn't research-based also protects you from misinformation and helps maintain scientific integrity. Anecdotes may be emotionally compelling or reflect real issues, but they lack the systematic controls needed to rule out alternative explanations. Similarly, just because a psychologist is quoted in an article does not mean the information is supported by a formal study. Experts may speculate based on clinical experience, but until those speculations are tested, they remain hypotheses, not conclusions.
In your role as a consumer of psychological information, you’ll often encounter claims that sound scientific but lack proper evidence. Some of these may be embedded in self-help books, therapy blogs, or even academic conference talks. Always ask yourself: Is this claim supported by data? What type of claim is being made—frequency, association, or causal? Was the information peer-reviewed? If you can’t find answers to these questions, it’s wise to treat the claim with caution.
To conclude, not all claims about psychology stem from research, and not all sources are equally reliable. Being able to distinguish between anecdote and evidence, between speculation and systematic investigation, is a crucial part of scientific literacy. When in doubt, look for peer-reviewed studies, clearly defined variables, and sound methodology. If you don’t see those things, it doesn’t mean the information is useless—it just means you should view it as suggestive, not conclusive. The ability to make this distinction is one of the most important habits of mind you can develop as a psychology student and as a critical thinker more broadly.
Summary
In psychology, researchers make different kinds of claims about behavior and mental processes. This post explained the three main types: frequency, association, and causal claims. A frequency claim tells us how often something happens, like how many people report feeling stressed each day. These claims involve only one variable and are usually based on surveys or observational data. To evaluate them, we look at how well the variable was measured and whether the study used a sample that represents the broader population.
An association claim describes a link between two variables—like saying that more sleep is related to lower stress. These claims are based on correlations, which show patterns in how variables move together. Associations can be positive (both variables go up), negative (one goes up, the other goes down), or zero (no clear pattern). These claims help us make predictions, but they do not prove that one variable causes another.
A causal claim goes a step further and says that one variable actually causes a change in another—like saying that deep breathing reduces anxiety. These are the strongest types of claims, and they require experimental evidence. To support a causal claim, researchers need to show that the variables are related (covariance), that the cause came before the effect (temporal precedence), and that no other factors can explain the relationship (internal validity). This usually involves experiments with random assignment and careful control of variables.
This post also warned against confusing claim types. Sometimes, news headlines or social media posts make strong causal claims based on weak evidence—like saying “playing video games causes violence” when the study only showed a correlation. Being able to tell the difference between these claims helps you think more critically about what you read.
Key Takeaways
Frequency, association, and causal claims differ in the number of variables involved, the kind of language used, and the type of evidence required to support them.
Association claims describe relationships between variables and can support predictions, but they do not prove causation.
Causal claims require rigorous criteria—covariance, temporal precedence, and internal validity—and are supported by experimental designs.
Zero, positive, and negative associations each describe distinct patterns in how variables relate, and each requires valid measurement and statistical evaluation.
Not all claims are research-based; discerning whether a claim is supported by empirical data or anecdote is a foundational skill in scientific literacy.
Glossary
anecdote: a personal story or individual case that may offer insight but lacks the controls and generalizability of scientific research.
association claim: a statement that two variables are related in a systematic way, without implying that one causes the other.
causal claim: a statement that one variable causes a change in another, supported by experimental evidence that meets the criteria of covariance, temporal precedence, and internal validity.
claim: an assertion about a psychological phenomenon, often based on data, that takes the form of a frequency, association, or causal statement.
construct validity: how well a variable has been measured or manipulated, reflecting whether it accurately represents the intended concept.
covariance: the requirement for causal claims that two variables must be associated—if one changes, the other tends to change as well.
empirical evidence: data collected through systematic observation or experimentation that supports or refutes a claim.
frequency claim: a statement about how common or widespread a single variable is within a population, such as a percentage or average.
internal validity: the extent to which a study rules out alternative explanations, supporting a conclusion that one variable caused a change in another.
operational definition: a specific way in which a concept is measured or manipulated in a study to allow empirical testing.
prediction: a probabilistic inference about one variable based on its association with another, without assuming a causal link.
research-based: supported by systematically collected and analyzed data, typically peer-reviewed and replicable.
scatterplot: a visual representation of the relationship between two variables, often used to display patterns in association claims.
statistical validity: how well a study’s statistical conclusions reflect the true relationships between variables, considering effect size, significance, and error margins.
temporal precedence: the principle that the cause must occur before the effect in time—an essential requirement for making a causal claim.
zero association: a finding that two variables do not have a consistent relationship; changes in one variable do not predict changes in the other.
About the Authors
Zachary Meehan earned his PhD in Clinical Psychology from the University of Delaware and serves as the Clinic Director for the university's Institute for Community Mental Health (ICMH). His clinical research focuses on improving access to high-quality, evidence-based mental health services, bridging gaps between research and practice to benefit underserved communities. Zachary is actively engaged in professional networks, holding membership affiliations with the Association for Behavioral and Cognitive Therapies (ABCT) Dissemination and Implementation Science Special Interest Group (DIS-SIG), the BRIDGE Psychology Network, and the Delaware Project. Zachary joined the staff at Biosource Software to disseminate cutting-edge clinical research to mental health practitioners, furthering his commitment to the accessibility and application of psychological science.

Fred Shaffer earned his PhD in Psychology from Oklahoma State University. He is a biological psychologist and professor of Psychology, as well as a former Department Chair at Truman State University, where he has taught since 1975 and has served as Director of Truman’s Center for Applied Psychophysiology since 1977. In 2008, he received the Walker and Doris Allen Fellowship for Faculty Excellence. In 2013, he received the Truman State University Outstanding Research Mentor of the Year award. In 2019, he received the Association for Applied Psychophysiology and Biofeedback (AAPB) Distinguished Scientist award. He teaches Experimental Psychology every semester and loves Beth Morling's 5th edition.


Comments