
The Clinician Detective: First Inspect the Raw EEG
- Fred Shaffer
- Jun 6, 2025
- 23 min read

Updated: Jul 30, 2025

Dr. Ronald Swatzyna, Director and Chief Scientist of the Houston Neuroscience Brain Center, inspired our Clinician Detective series. In his Association for Applied Psychophysiology and Biofeedback (AAPB) Distinguished Scientist address, he reminded his audience that the DSM-5 advises that general medical conditions be systematically ruled out before assigning a psychiatric diagnosis to ensure diagnostic validity and appropriate treatment planning. He argued that in abrupt onset and refractory cases, EEG biomarkers should challenge neurofeedback providers and their medical colleagues to become detectives to identify its causes. This collaborative approach allows each professional to contribute to assessment while "staying in their lane."

Dr. Swatzyna generously mentors professionals in his investigative method, including raw EEG interpretation, to train the next generation of neurofeedback clinicians.
Introduction: Seeing the Brain Clearly Requires More Than Maps
This post is based on Dr. Swatzyna's groundbreaking BCIA webinar, "The Yeah Buts of qEEG - Why the qEEG Doesn't Always Tell the Full Story." We encourage you to purchase this neurofeedback mentoring webinar from BCIA.

In modern neurofeedback and psychophysiological practice, quantitative EEG (qEEG) offers enticing possibilities. The qEEG processes EEG data to generate statistical and visual maps of brain activity.

These brain maps, derived from statistical comparisons of an individual's EEG to normative databases, seem to offer quick insight into abnormal patterns (Thatcher, 1998). They render in vivid topographies what was once inscrutable to the untrained eye. However, relying solely on these maps—without inspecting the underlying raw electroencephalogram (EEG)—can lead to clinical errors, missed diagnoses, or misguided training protocols.
This post affirms the qEEG's value as a complementary tool in neurofeedback and psychophysiological assessment. Topographic maps and statistical comparisons can highlight meaningful patterns when appropriately interpreted. However, the qEEG should never precede or replace the visual inspection of the raw EEG. Clinical accuracy depends on seeing what the brain is actually doing moment by moment—not just what the averages suggest.
Used responsibly, the qEEG enhances interpretation; used in isolation, it risks misrepresentation. The position advanced here is not anti-qEEG, but pro-context: maps should follow, not substitute for, raw waveform examination.
This post will make the case that reading the raw EEG is not optional; it is essential. Drawing on examples provided by Dr. Swatzyna, we will explore how artifacts masquerade as pathophysiology, how misclassifications arise from fixed frequency bins, and why morphology—the shape and rhythm of brain waves—matters. We will illustrate how qEEG maps, though valuable, often prioritize the brain's statistical “sky” over its physiological “ground.”
When we consider the power of qEEG, it is easy to be seduced by its visual clarity and the precision of its comparisons. However, the underlying reality is far more nuanced. A brain map may highlight abnormalities, but unless those features are visible and interpretable in the raw EEG, their clinical meaning may be doubtful or outright misleading.
Clinicians are often unaware that qEEG relies heavily on data quality, artifact rejection methods, and bandpass filters that may erase or distort meaningful events. Moreover, normative databases are built from select populations and often do not reflect neurodiverse presentations.
The only way to ensure that the statistical map corresponds to neurophysiological reality is to examine the EEG in its unfiltered, continuous waveform form. In this way, reading the raw EEG is not an optional enhancement—it is the bedrock of valid neurophysiological interpretation.
The Map Is Not the Territory: How qEEG Can Mislead
Jay Gunkelman’s warning against becoming a "hotspotologist” is a caution against overinterpreting isolated areas of deviation on qEEG topographic maps without confirming them in the raw EEG. Hotspotology refers to focusing narrowly on bright or dark regions—statistical "hot spots"—in color-coded brain maps and assuming they represent true neural abnormalities that warrant intervention.

This approach can jeopardize client care because these apparent deviations may be caused by transient artifacts, non-neuronal signals (such as sweat or eye movement), or statistical outliers that are not supported by the underlying electrophysiological activity.
When clinicians act on hotspots without verifying morphology, rhythmicity, and context in the raw EEG and clinical correlation, they risk treating artifact as pathology, suppressing healthy brain function, or missing more diffuse or transient patterns that better explain their client’s symptoms.
As this post shows through Dr. Swatzyna’s case examples, raw EEG review is essential to differentiate genuine physiological findings from misleading statistical anomalies. Gunkelman’s warning is thus a call to maintain rigorous clinical standards, where interpretation is grounded in electrophysiological validity, not aesthetic map features.
The quantitative EEG (qEEG) uses statistical algorithms to transform raw EEG signals into topographic maps showing power, asymmetry, and coherence across the scalp. These maps use color-coded gradients to indicate the power or connectivity of different frequency bands at various electrode locations, offering a statistical snapshot of brain function compared to a normative database. While they can highlight deviations from typical patterns, these maps average activity over time and may obscure brief but clinically meaningful events. Therefore, clinicians must interpret topographic findings within the context of the raw EEG, which preserves the temporal detail and waveform morphology essential for accurate analysis.
These maps are only as accurate as their input data—and can be catastrophically misleading if that data includes unrecognized artifacts.
An artifact is any signal that is not generated by cortical neurons—such as eye movement, muscle tension, sweat, or electrical interference. One striking example presented by Dr. Swatzyna involved excessive delta power in frontal regions. While a qEEG map flagged this as pathological, a review of the raw EEG revealed it was caused by slow eye movements—not cerebral dysfunction.
Another example featured a clinician who submitted a beautifully flat, low-voltage EEG recording for qEEG processing. The maps appeared strikingly symmetrical and showed minimal deviations from the norm. However, this perfection was suspicious. Upon inspection of the raw EEG, it became apparent that the patient had made no eye movements whatsoever, and the overall signal amplitude was far below what is typical for a resting EEG. Further investigation revealed that the EEG cap had been moist from prior use, leading to current spread and signal attenuation.
What looked like a neurologically underpowered brain was actually an equipment and preparation failure. If interpreted in isolation, the qEEG map might have prompted unnecessary medical referrals, misdiagnosis, or cognitive decline assumptions.
The issue here is not with the qEEG technology itself but with the assumption that maps can replace the need for clinical interpretation. A map is only a model, and like any model, it carries assumptions, blind spots, and distortions.
The algorithms that generate statistical comparisons do not “know” whether a given pattern is due to biology or equipment error. Only a trained human eye can make that determination by comparing the raw waveforms to known physiological norms. Moreover, many clinicians outsource their qEEG processing to third-party labs that use automated artifact rejection. These systems may exclude segments of data with blinking or movement, inadvertently deleting clinically significant information like brief discharges or focal slowing (John & Prichep, 2006).
In both cases, raw EEG inspection served as the safeguard against erroneous interpretation. It revealed what the automated system could not: the true nature of the signal. Without it, the clinician might have pursued inappropriate interventions based on artificial features.
This underscores the point that qEEG maps reflect a processed abstraction—they are not objective truth, and their validity depends entirely on what lies beneath. Reading the raw EEG is not merely a professional courtesy—it is the only way to clinically validate a map. By committing to visual inspection of the EEG record, clinicians can ensure that treatment decisions are grounded in biological evidence, not statistical artifact.
Artifacts in Disguise: When Eye Movements and Muscle Tension Impersonate EEG Waveforms
Many qEEG users fail to realize just how often non-neural signals contaminate EEG data (Nuwer et al., 1999). Eye movements can produce low-frequency transients—especially in the frontal leads—that may resemble delta activity in topographic displays. These ocular artifacts, including blinks and vertical saccades, typically generate slow, biphasic waves that can be mistaken for frontal delta or theta unless carefully identified through morphology and topographic distribution in the raw EEG. Occular artifacts are especially problematic in prefrontal electrodes—exactly where many protocols target anxiety or executive function. In one example presented by Dr. Swatzyna, delta appearing in F7 and F8, the lateral prefrontal leads. On the map, it looked pathological. But the raw EEG told another story: the waves were steep, asymmetric, and time-locked to blinks. They were not true cortical delta, but simply eye movement.
Muscle tension presents another insidious challenge. Electromyographic (EMG) artifact produces high-frequency noise, often contaminating the beta and gamma bands. EMG artifact is contamination of the EEG by muscle activity, common in the temporalis and frontalis muscle regions—again, where clinicians often focus.
Without examining the waveform morphology—its contour, frequency, and rhythmicity—these artifacts may be mistaken for hyperarousal or even seizure activity. One example showed beta “excess” that resolved when the patient stopped clenching their jaw. The patient was initially thought to have anxiety-related overactivation, but in truth was simply exhibiting facial tension under stress. Misidentifying this as cortical beta could have resulted in unnecessary downtraining protocols, reducing true cortical activation and increasing mental fog.
In another case, a practitioner observed elevated theta in a client who appeared to be falling asleep. The qEEG map showed diffuse theta dominance, leading to a misdiagnosis of mild cognitive impairment. But raw EEG showed that the patient had been intermittently nodding off during the recording. This distinction matters. Treatment for cognitive decline versus treatment for drowsiness involves entirely different strategies, from neurofeedback targets to medical referrals. Without direct inspection of the raw EEG, such errors would go uncorrected.
Sweat artifacts and electrode bridging due to moist caps can also obscure interpretation. Sweat artifacts comprise low-frequency, high-amplitude signal distortion caused by perspiration altering electrode impedance or conductance, often resulting in slow drifts that mimic delta activity.
Electrode bridging artifacts consist of signal contamination resulting from conductive gel or moisture spreading between adjacent electrodes, causing artificial synchrony or signal flattening due to volume conduction.
A low-voltage EEG might be due not to cortical underactivation but to poor contact, saline spread, or skin conductance shifts. In one example, a child’s EEG was interpreted as globally suppressed. The qEEG showed unusually flat power across all bands. Upon inspection, it was determined that the cap had been applied while the child was sweating and agitated. After re-recording in a cooler environment with dried electrodes, the EEG showed strong, healthy alpha and beta activity. The initial map had falsely portrayed the child as encephalopathic.
By relying solely on qEEG maps, clinicians may unwittingly treat non-existent deficits or miss genuine ones. The raw EEG, in contrast, allows direct inspection of the waveforms, enabling clinicians to spot contamination, validate rhythms, and make defensible judgments.
Artifact identification is a skill developed over time. The more EEGs a clinician reads, the more proficient they become at identifying anomalies that machines cannot flag. Without this scrutiny, the risk of treating artifact as pathology remains unacceptably high.
Fixed Frequency Bands: The Problem with Arbitrary Bins
One of the lesser-known but critical limitations of qEEG is its reliance on fixed frequency bins—predetermined ranges such as delta (1–4 Hz), theta (4–8 Hz), alpha (8–12 Hz), beta (12–30 Hz), and gamma (>30 Hz). While these bands are rooted in tradition and offer convenience, they often fail to capture individual variability (Klimesch, 1999).
Brain wave frequencies do not always conform to these neat boundaries. Dr. Swatzyna provided several examples where fixed bins led to misclassifications with serious clinical implications. For instance, in a case involving a 16-year-old male referred for ADHD evaluation, the qEEG map showed elevated theta and diminished beta—suggesting a high theta/beta ratio.
However, visual inspection of the raw EEG revealed a dominant rhythm centered at 7.8 Hz. This slow alpha was misclassified as theta, inflating theta power artificially. As a result, the map suggested cognitive underarousal when the underlying physiology reflected an idiosyncratic alpha peak.

Based on the spectral peaks, the eyes-open relative power display confirms that the "theta" is actually slow alpha.
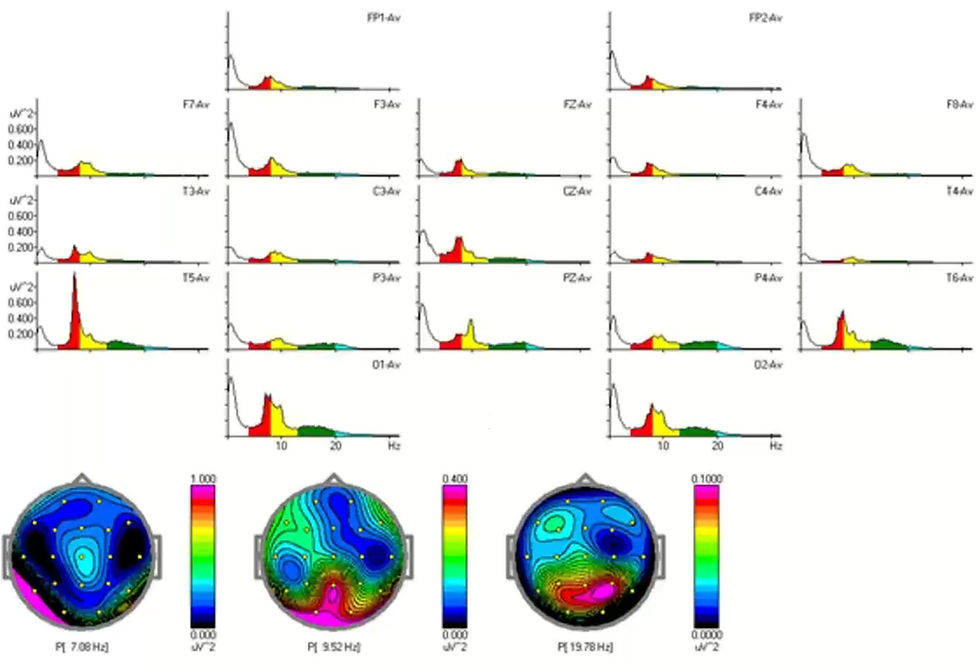
Dr. Swatzyna cautions that if a qEEG abnormality is not present in the raw EEG, its clinical validity is uncertain.
Certain patterns may emerge in quantitative analysis (e.g., spectral abnormalities) that are not easily discernible visually. Conversely, some events visible in raw EEG (e.g., brief paroxysms or spikes) are not captured by spectral qEEG due to their transient nature.

Also, due to fixed frequency bins, 7-8 Hz alpha looks hypercoherent when it is not.

In another example, a high-performing college student with complaints of anxiety showed no significant abnormalities on their qEEG report. Yet raw EEG inspection told a different story. The student’s alpha peak was at 12.5 Hz, meaning much of their alpha activity had bled into the lower beta band. The qEEG system, adhering rigidly to predefined bins, categorized this as beta excess while underrepresenting true alpha power. Consequently, no meaningful alpha peak was detected, and no alpha reactivity could be assessed. If a clinician were to rely only on the map, they might wrongly conclude that the patient lacked posterior alpha rhythm—a classic indicator of neurotypical resting state regulation.
The risk of error becomes even greater when clinical decisions are based on derivative measures such as the theta/beta ratio. Widely used in ADHD screening, this ratio is computed from the absolute or relative power in the theta and beta bands. However, if either band is contaminated by misclassified alpha, the ratio becomes meaningless. Alpha below 8 Hz increases the theta/beta ratio and creates the illusion of hypercoherence. Conversely, alpha above 12 Hz decreases the theta/beta ratio and creates the illusion of hypocoherence. These errors are produced by a normative database's fixed alpha and theta ranges.
Dr. Swatzyna emphasized how a skewed theta/beta ratio—based on incorrect binning—can mislead physicians toward prescribing stimulants inappropriately. The risk is not merely theoretical. In some cases, children were placed on long-term stimulant regimens based on misleading ratios, despite raw EEGs showing strong alpha dominance and no true theta excess.
Another pitfall of fixed bands is the inability to detect or accommodate bifurcated alpha peaks—instances where a patient shows two distinct alpha frequencies, such as one at 7.5 Hz and another at 10.5 Hz. These profiles are often seen in transitional neurodevelopmental stages or in individuals using substances such as THC. While not inherently pathological, this pattern may reflect altered thalamocortical regulation or neurochemical modulation, warranting clinical context for interpretation.
On a qEEG map, such a profile may appear as alpha suppression or even disorganization. Although a relative power map cannot show bifurcated alpha, it can show where the slower peak is more dominant (for example, 7-8 Hz in the left temporal lobe).

But when visualized through a spectrogram or closely examined in the raw EEG, these double peaks become obvious. Dr. Swatzyna noted that in one such case, a bifurcated alpha pattern was mistaken for excessive theta and low SMR beta—again leading to treatment based on artifact rather than fact.

To make matters more complex, normative databases vary in how they define frequency bins and what criteria they use to compute deviation scores. A 10 Hz alpha in one database might be seen as dominant and healthy; in another, it might barely register above baseline. These discrepancies can lead to inconsistent interpretations across providers and platforms.
Dr. Swatzyna urged clinicians to consider raw EEG review as a form of triangulation—confirming whether deviations shown on the map align with what the brain is actually doing. Frequency misclassification is not just a data issue; it’s a clinical hazard.
Ultimately, qEEG frequency bins represent convenient simplifications of complex, individualized brain rhythms. While useful for broad comparisons, they can obscure or distort meaningful differences when applied rigidly. By contrast, raw EEG analysis respects the continuous nature of brain oscillations, allowing clinicians to adapt their interpretation to the person—not the protocol.
As Dr. Swatzyna repeatedly emphasized, if clinicians are to move from map reading to clinical neurophysiology, they must prioritize waveform observation over arbitrary metrics. Only then can frequency-based metrics such as the theta/beta ratio regain their clinical utility.
Signal Shape Matters: Morphology as a Diagnostic Compass
The importance of waveform morphology—how EEG waves look over time—cannot be overstated (Niedermeyer & Lopes da Silva, 2011). While frequency and amplitude offer quantitative metrics, morphology allows qualitative interpretation.
Dr. Swatzyna repeatedly emphasized that certain shapes correspond to specific neurophysiological phenomena. For example, sinusoidal alpha waves, with their smooth and rounded contours, reflect stable thalamocortical loops and are often seen in calm, awake individuals with eyes closed. In contrast, theta waves appear flatter and more irregular, often associated with drowsiness, inattention, or subcortical disinhibition.
When raw EEG is ignored, these distinctions blur, and clinicians may act on incorrect assumptions. In one case, a patient’s spiky alpha was flagged as epileptiform in a qEEG report. But after examining the raw EEG, it became clear that the sharp appearance was due to overlapping alpha peaks, not pathology. Misidentifying this pattern could have led to anticonvulsant use inappropriately.
Another powerful illustration came from a patient who exhibited transient spikes that were initially treated as muscle artifact. However, Dr. Swatzyna reviewed the morphology and noted their consistent timing, topography, and after-going slow wave—hallmarks of epileptiform discharges. These spikes were focal, occurring in the left temporal region, and their brief duration aligned with clinical symptoms of momentary confusion. The qEEG maps, which average signals over time and rely on automated artifact rejection, had discarded these crucial events as noise. If the raw EEG had not been inspected, a seizure diagnosis would have been missed entirely.
Morphology also helps distinguish between types of beta activity. Fast beta may be physiological in high-functioning individuals or pathological in the context of benzodiazepine withdrawal, traumatic brain injury, or neuroinflammation.
Dr. Swatzyna described the spindling beta pattern (SEB)—brief bursts of symmetrical, fast-frequency activity, sometimes referred to as F1 and F2 forms. F1 consists of small, low-amplitude bursts, while F2 represents larger, more disruptive patterns. These signatures can indicate a history of benzodiazepine use or sensitivity to GABAergic modulation. Such insight cannot be gleaned from color maps alone—it requires watching the wave unfold on screen.
Finally, Dr. Swatzyna highlighted that morphology can signal underlying metabolic or toxic issues. One child’s EEG showed low-voltage, poorly formed alpha waves with intermittent sharp activity—initially presumed to be nonspecific slowing. Upon further medical evaluation, the child was found to have mold toxicity and impaired methylation pathways. Without attention to morphology, this pattern would have been dismissed or labeled as “nonspecific,” delaying essential environmental and metabolic interventions. Morphology told a story the map could not have written.
In sum, morphology is not cosmetic—it is diagnostic. Clinicians must become literate in waveform patterns, just as radiologists interpret shadowing or contour in imaging.
As Dr. Swatzyna argues, to treat the brain responsibly, we must not just measure its rhythms—we must learn to see them.
The Map Misses the Moment: Background vs. Events
While qEEG maps summarize average brain activity over time, they are blind to transient events—brief, clinically significant discharges that last mere milliseconds (Tatum, 2014). These momentary phenomena often vanish in statistical averaging and are discarded by automated artifact rejection systems. Dr. Swatzyna emphasized that this is one of the most dangerous limitations of relying solely on processed maps.
In one case, a child was repeatedly misdiagnosed with behavioral dysregulation, and his treatment history included various stimulant and mood stabilizer regimens. The qEEG revealed no clear anomalies. But when Dr. Swatzyna reviewed the raw EEG, he identified sharp transients near the central motor strip—electrical discharges consistent with abdominal seizures. The child’s erratic behavior and episodic stomach pain finally made sense. A referral to a pediatric neurologist confirmed the seizure activity, and after appropriate anticonvulsant treatment, the child’s symptoms dramatically improved. The key clinical marker had been erased by artifact rejection.
Another example involved a young woman experiencing episodes of emotional volatility and occasional disorientation. The qEEG suggested left temporal slowing, but offered no concrete diagnostic pattern.
Dr. Swatzyna examined the raw EEG and noted intermittent spikes at T3, each followed by a slow wave—a morphology consistent with temporal lobe epilepsy. These were isolated epileptiform discharges (IEDs), not frequent enough to influence average spectral power, but potentially significant in generating psychiatric symptoms. Treating this patient with traditional mood stabilizers or SSRIs would likely have worsened her condition.

The same client exhibited three paroxysms in 10 minutes. These are episodic, sharply demarcated discharges that differ from the background EEG activity in frequency, morphology, and/or amplitude. A qEEG map would not show a clinician where to train, whereas the raw EEG can reveal the first discharge's location.
Following EEG confirmation and a second opinion, she was started on a low-dose anticonvulsant with positive clinical response. Once again, it was not the map but the moment—the raw discharge—that told the true story.
A similar pattern emerged in the EEG of a high-functioning adult with persistent anxiety, insomnia, and difficulty concentrating. His qEEG maps indicated elevated beta, but lacked other defining abnormalities. Dr. Swatzyna cautions that clinicians should be suspicious of qEEG findings lacking clinical correlation. We should not attempt to train them if they are not confirmed by the raw EEG because they are probably mirages. The raw EEG told a more compelling narrative. Dr. Swatzyna observed rhythmic slowing in the left anterior temporal region—a potential marker for treatment-resistant depression, especially when accompanied by unresponsiveness to three or more antidepressants. This focal slowing was rhythmic and recurrent but too spatially localized and brief to register as significant on the qEEG summary. It also guided a highly targeted referral for transcranial magnetic stimulation (TMS), which ultimately succeeded after multiple failed medication trials. None of this would have been possible without examining the transient pattern in raw form.
Event-level analysis also plays a vital role in interpreting coherence and asymmetry patterns (Barry et al., 2002). One patient exhibited high frontal theta coherence on their qEEG, suggesting hyperconnectivity often associated with developmental delays or traumatic brain injury. But the raw EEG revealed bursts of high-amplitude theta during drowsiness, interspersed with normal waking rhythms. These intermittent artifacts distorted the overall coherence calculation.
Had they been interpreted as trait-level hypercoherence, the patient might have been subjected to unnecessary coherence training. Hypercoherence is an abnormally high level of synchronization between EEG signals at two or more electrode sites, often reflecting reduced functional differentiation. Once the transients were recognized and excluded from interpretation, a much more accurate clinical picture emerged—one of fluctuating arousal rather than stable connectivity abnormality.
Finally, Dr. Swatzyna described a rare case involving low-voltage fast activity that initially appeared to be benign. However, upon reviewing the raw EEG, he noticed a progression of high-frequency activity evolving into a clear seizure pattern. The qEEG had classified this section as “normal beta,” but in context, it was the prelude to a subclinical seizure. Instructed by this observation, the clinician referred the patient for continuous video EEG monitoring, which confirmed the seizure diagnosis. This example illustrates how qEEG, by discarding context and temporal sequence, can obscure dynamic brain states that require immediate clinical attention.
In each of these cases, the signal of interest—the diagnostic fingerprint—did not reside in the averaged data but in the unique moment of emergence, disruption, or discharge. These are the moments when the brain speaks most clearly about its internal condition. Only the raw EEG can capture them in their full temporal and spatial nuance.
Dr. Swatzyna’s cases repeatedly demonstrate that overlooking these moments in favor of maps risks missing the forest for the trees. In EEG, it is not just the pattern but the pulse that matters.
Summary
Clinicians who work with EEG must not surrender their interpretive responsibility to software-generated qEEG maps. As Dr. Swatzyna’s clinical cases show, maps provide a useful overview, but they cannot reveal the subtle dynamics, artifacts, or transient events that shape the diagnostic landscape. Raw EEG, in contrast, offers direct access to the language of the brain—its pulses, shapes, and rhythms. Each waveform tells a story that a statistical average cannot: a hidden seizure, a misclassified alpha, a burst of muscle tension misread as beta excess. These differences are not technicalities—they are turning points in a person’s diagnosis and treatment path.
Across each of the five domains explored—misleading maps, hidden artifacts, frequency bin errors, morphological features, and overlooked transients—a clear message emerges: clinical confidence must be grounded in visual confirmation. Every qEEG map must be validated by inspecting the raw signal. Decisions should not be based solely on color gradients or deviation scores but on patterns that a trained eye can trace across time and space. The work of interpretation requires skill, humility, and an unyielding commitment to understanding the individual brain in front of us, not just the normative group to which it is compared.
When raw EEG is ignored, the clinician risks mistaking artifact for insight and averages for answers. When raw EEG is embraced, every clinical decision becomes more precise, more personal, and more protective. This is not a rejection of qEEG—it is its contextualization. Raw EEG is not a fallback. It is the standard. It anchors maps in meaning, guides training protocols with accuracy, and protects patients from misguided interventions. Ultimately, to treat the brain wisely, we must first learn to read it fluently. And that fluency begins with the raw.
Key Takeaways
Always inspect the raw EEG before accepting qEEG findings. Statistical maps may overlook or misclassify critical features like eye movement, muscle tension, or subtle discharges.
Artifacts frequently mimic pathology. Without waveform verification, eye blinks may look like frontal delta, and jaw clenching may appear as beta excess, leading to inappropriate diagnoses.
Fixed frequency bands can misclassify normal activity. A slow alpha peak may be misread as theta, inflating ADHD indices; a fast alpha may be wrongly labeled as beta, masking healthy rhythms.
Morphology matters. Spikes, sharp waves, and spindling beta patterns can only be accurately identified by reviewing the shape and sequence of waveforms in the raw EEG.
Transient events are often the most clinically important. Isolated epileptiform discharges, brief slowing, or pre-seizure beta escalation may be discarded by automated processes yet hold decisive clinical meaning.
qEEG averages hide important variability. qEEG maps flatten the temporal dynamics of brain activity, while raw EEG preserves the ebb and flow of real-time functioning.
Normative databases are limited in scope. They are based on population averages and may not accommodate neurodiverse brains, high-functioning individuals, or developmental transitions.
Interpretation is an expert skill, not a software output. Clinical insight requires pattern recognition, contextual understanding, and a trained eye—skills that no algorithm can replace.
Glossary
alpha rebound effect: a counterintuitive increase in alpha power following alpha-desynchronizing neurofeedback, thought to result from homeostatic plasticity restoring cortical excitability balance.
alpha rhythm: a sinusoidal EEG pattern typically between 8–12 Hz, most prominent over posterior regions during relaxed wakefulness with eyes closed.
artifact: a non-cerebral signal in the EEG recording, often due to muscle movement, eye motion, sweating, or electrical interference.
asymmetry: the difference in amplitude or power between homologous electrodes on opposite sides of the head.
automated artifact rejection: a software-based process that removes EEG segments flagged as contaminated, often discarding transient clinical events.
beta waves: EEG activity ranging from roughly 13–30 Hz, associated with alertness and cognitive activity; may be spindled in cases of drug influence.
bifurcated alpha: the presence of two distinct peaks within the alpha range, often reflecting developmental transitions or cannabis effects.
coherence: a measure of synchrony or connectivity between signals from two electrode sites, reflecting functional communication.
cortical underactivation: a condition in which cortical neurons exhibit lower-than-expected electrical activity, often reflected as reduced beta and alpha power or excessive slow-wave activity in EEG; may be associated with fatigue, attentional deficits, depression, or the influence of sedative medications.
delta waves: slow waves (1–4 Hz) typically associated with deep sleep; frontal delta in waking states is often artifact.
diffuse theta dominance: a pattern in EEG or qEEG showing elevated theta power across multiple brain regions, typically interpreted as a marker of underarousal, fatigue, inattention, or delayed cortical maturation; however, it may also result from misclassified alpha or artifact.
downtraining: a neurofeedback intervention that aims to reduce the amplitude or power of a specific EEG frequency band—such as high beta—often used to decrease symptoms of anxiety, hyperarousal, or cortical overactivation; may lead to adverse effects if misapplied to healthy or misclassified activity.
electromyographic (EMG) artifact: contamination of the EEG by muscle activity, especially in the high-frequency beta and gamma bands.
epileptiform discharge: an abnormal spike or sharp wave in the EEG, often accompanied by a slow wave, indicating seizure potential.
event-level analysis: a method of EEG interpretation that focuses on identifying and evaluating brief, non-continuous signal abnormalities—such as spikes, sharp waves, or rhythmic bursts—within the raw waveform, rather than relying on averaged data; essential for detecting clinically significant but transient brain activity often missed by qEEG summaries.
F1: a subtype of spindling beta marked by small, low-amplitude bursts of high-frequency activity (typically 14–20 Hz), often symmetrical and transient; associated with benzodiazepine exposure, neuroinflammation, or post-infectious encephalopathy.
F2: a subtype of spindling beta characterized by large, symmetrical bursts of high-frequency beta activity (typically 14–20 Hz) with a waxing and waning morphology; often associated with the effects of benzodiazepines, barbiturates, or neuroinflammation.
focal slowing: regionally localized slow-wave activity, which may indicate structural lesions or prior injury. focal spikes: brief, sharply contoured waveforms localized to a specific electrode region, typically indicating hyperexcitability in that cortical area and commonly associated with focal epilepsy.
focus: is a discrete cortical area from which abnormal neuronal discharges originate. This term is most commonly used in the context of epileptiform activity or pathological slowing.
frequency bin: a fixed frequency range (e.g., theta = 4–8 Hz) used in qEEG to categorize power by band.
gamma activity: high-frequency EEG activity (> 30 Hz), often associated with integrative functions but easily contaminated by muscle artifact.
high-frequency activity: EEG signals typically above 13 Hz, including beta (13–30 Hz) and gamma (>30 Hz), often associated with cognitive processing, sensory integration, or alertness, but also susceptible to contamination by muscle artifacts and sometimes indicative of pathological or medication-induced states.
hotspotology: a term coined by Jay Gunkelman to describe the clinical overreliance on visually striking areas ("hotspots") of deviation on qEEG topographic maps without validating them in the raw EEG. This approach can lead to erroneous conclusions and mistargeted interventions by treating artifact or benign variation as pathology.
hypercoherence: an abnormally high level of synchronization between EEG signals at two or more electrode sites, often reflecting reduced functional differentiation, and potentially linked to traumatic brain injury, neurodevelopmental delays, or compensatory overconnectivity.
intermittent spikes: occasional, non-rhythmic, and isolated high-amplitude waveforms with sharp morphology that appear sporadically in the EEG; they may reflect underlying epileptiform activity even in the absence of clinical seizures.
isolated epileptiform discharge (IED): a brief, sharp waveform suggestive of seizure risk, not part of a generalized epileptic pattern.
low-voltage EEG: EEG with overall reduced amplitude, potentially caused by skull thickness, medication, or poor recording technique.
normative database: a reference dataset used in qEEG to compare an individual’s brain activity to statistical norms.
qEEG (quantitative EEG): computer-processed EEG data used to generate statistical and visual maps of brain activity.
raw EEG: the unprocessed waveform data showing real-time electrical activity across multiple scalp electrodes.
sinusoidal alpha waves: alpha-band EEG activity (typically 8–12 Hz) characterized by smooth, rounded, and regular oscillations, often indicating healthy thalamocortical communication and most visible over occipital regions during relaxed wakefulness with eyes closed.
spindling beta: brief bursts of beta frequency activity, often symmetrical and associated with medication or neurological conditions.
theta/beta ratio: a comparison of power in the theta and beta bands, commonly used in ADHD evaluation.
theta waves: EEG activity in the 4–8 Hz range, often linked with drowsiness, inattention, or subcortical activation.
transcranial magnetic stimulation (TMS): a noninvasive neuromodulation technique that uses magnetic fields to stimulate nerve cells in targeted brain regions; often used in the treatment of major depressive disorder, particularly when patients are resistant to pharmacological interventions.
transient events: brief, time-limited EEG occurrences such as spikes, sharp waves, rhythmic bursts, or sudden changes in frequency or amplitude that may indicate clinically significant phenomena like seizures, arousal shifts, or localized pathology.
waveform morphology: the visual form and temporal structure of EEG waveforms, including their amplitude, symmetry, rhythmicity, and contour; crucial for distinguishing between normal and pathological activity such as alpha rhythms, epileptiform discharges, or muscle artifacts.
References
Barry, R. J., Clarke, A. R., Johnstone, S. J., & Brown, C. R. (2002). EEG coherence in children with attention-deficit/hyperactivity disorder and comorbid oppositional defiant disorder. Clinical Neurophysiology, 113(10), 1501–1505. https://doi.org/10.1016/S1388-2457(02)00194-9
Coburn, K. L., Lauterbach, E. C., Boutros, N. N., Black, K. J., Arciniegas, D. B., & Coffey, C. E. (2006). The value of quantitative EEG in clinical psychiatry: A report by the committee on research of the American Neuropsychiatric Association. Journal of Neuropsychiatry and Clinical Neurosciences, 18(4), 460–500. https://doi.org/10.1176/jnp.2006.18.4.460
John, E. R., & Prichep, L. S. (2006). The role of quantitative EEG in the diagnosis and management of psychiatric disorders. CNS Spectrums, 11(2), 153–162. https://doi.org/10.1017/S1092852900014292
Klimesch, W. (1999). EEG alpha and theta oscillations reflect cognitive and memory performance: A review and analysis. Brain Research Reviews, 29(2–3), 169–195. https://doi.org/10.1016/S0165-0173(98)00056-3
Niedermeyer, E., & Lopes da Silva, F. H. (Eds.). (2011). Electroencephalography: Basic principles, clinical applications, and related fields (6th ed.). Lippincott Williams & Wilkins. (No DOI; print book)
Nuwer, M. R., Comi, G., Emerson, R., Fuglsang-Frederiksen, A., Guérit, J. M., Hinrichs, H., Ikeda, A., Luccas, F. J., & Rappelsburger, P. (1999). IFCN standards for digital recording of clinical EEG. Electroencephalography and Clinical Neurophysiology, 106(3), 259–261. https://doi.org/10.1016/S0013-4694(98)00137-1
Nuwer, M. R., Hrachovy, R. A., Jayakar, P., Nuwer, M. R., Radtke, R. A., Rosenow, F., & Westmoreland, B. F. (2012). Evidence-based guideline update: EEG interpretation. Neurology, 79(9), 918–926. https://doi.org/10.1212/WNL.0b013e3182661f85
Tatum, W. O. (2014). Handbook of EEG interpretation (2nd ed.). Demos Medical Publishing.
Thatcher, R. W. (1998). Normative EEG databases and EEG biofeedback. Journal of Neurotherapy, 2(4), 8–39. https://doi.org/10.1300/J184v02n04_03
Thatcher, R. W. (2010). EEG normative databases and the diagnosis of mild traumatic brain injury. Clinical EEG and Neuroscience, 41(3), 93–99. https://doi.org/10.1177/155005941004100303
Zimmerman, E. M., & Konopka, L. M. (2014). Preliminary findings of single- and multifocused epileptiform discharges in nonepileptic psychiatric patients. Clinical EEG and neuroscience, 45(4), 285–292. https://doi.org/10.1177/1550059413506001
About the Author

Fred Shaffer earned his PhD in Psychology from Oklahoma State University. He earned BCIA certifications in Biofeedback and HRV Biofeedback. Fred is an Allen Fellow and Professor of Psychology at Truman State University, where has has taught for 50 years. He is a Biological Psychologist who consults and lectures in heart rate variability biofeedback, Physiological Psychology, and Psychopharmacology. Fred helped to edit Evidence-Based Practice in Biofeedback and Neurofeedback (3rd and 4th eds.) and helped to maintain BCIA's certification programs.
Support Our Friends


Comments